At UC Berkeley and at UC ANR, my outreach program involves the creation, integration, and application of research-based technical knowledge for the benefit of the public, policy-makers, and land managers. My work focuses on environmental management, vegetation change, vegetation monitoring, and climate change. Critical to my work is the ANR Statewide Program in Informatics and GIS (IGIS), which I began in 2012 and is now really cranking with our crack team of IGIS people. We developed the IGIS program in 2012 to provide research technology and data support for ANR’s mission objectives through the analysis and visualization of spatial data. We use state-of-the-art web, database and mapping technology to provide acquisition, storage, and dissemination of large data sets critical to the ANR mission. We develop and delivers training on research technologies related to important agricultural and natural resource issues statewide. We facilitate networking and collaboration across ANR and UC on issues related to research technology and data. And we deliver research support through a service center for project level work that has Division-wide application. Since I am off on sabbatical, I have decided to take some time to think about my outreach program and how evaluate its impact.
There is a great literature about the history of extension since its 1914 beginnings, and specifically about how extension programs around the nation have been measuring impact. Extension has explored a variety of ways to measure the value of engagement for the public good (Franz 2011, 2014). Early attempts to measure performance focused on activity and reach: the number of individuals served and the quality of the interaction with those individuals. Through time, extension began to turn their attention to program outcomes. Recently, we’ve been focusing on articulating the Public Values of extension, via Condition Change metrics (Rennekamp and Engle 2008). One popular evaluation method has been the Logic Model, used by extension educators to evaluate the effectiveness of a program through the development of a clear workflow or plan that links program outcomes or impacts with outputs, activities and inputs. We’ve developed a fair number of these models for the Sierra Nevada Adaptive Management Program (SNAMP) for example. Impacts include measures of changes in learning, behavior, or condition change across engagement efforts. Recently, change in policy became an additional measure to evaluate impact. I also think measuring reach is needed, and possible.
So, just to throw it out there, here is my master table of impact that I try to use for measuring and evaluating impact of my outreach program, and I’d be interested to hear what you all think of it.
- Change in reach: Geographic scope, Location of events, Number of users, etc.
- Change in activity: Usage, Engagement with a technology, New users, Sessions, Average session duration
- Change in learning; Participants have learned something new from delivered content
- Change in action, behavior, method; New efficiencies, Streamlined protocols, Adoption of new data, Adoption of best practices
- Change in policy; Evidence of contributions to local, state, or federal regulations
- Change in outcome: measured conditions have improved = condition change
I recently used this framework to help me think about impact of the IGIS program, and I share some results here.
Measuring Reach. The IGIS program has developed and delivered workshops throughout California, through the leadership of Sean Hogan, Shane Feirer, and Andy Lyons (http://igis.ucanr.edu/IGISTraining). We manage and track all this activity through a custom data tracking dashboard that IGIS developed (using Google Sheets as a database linked to ArcGIS online to render maps - very cool), and thus can provide key metrics about our reach throughout California. Together, we have delivered 52 workshops across California since July 2015 and reached nearly 800 people. These include workshops on GIS for Forestry, GIS for Agriculture, Drone Technology, WebGIS, Mobile Data Collection, and other topics. This is an impressive record of reach: these workshops have served audiences throughout California. We have delivered workshops from Humboldt to the Imperial Valley, and the attendees (n=766) have come from all over California. Check this map out:

Measuring Impact. At each workshop, we provide a feedback mechanism via an evaluation form and use this input to understand client satisfaction, reported changes in learning, and reported changes in participant workflow. We’ve been doing this for years, but I now think the questions we ask on those surveys need to change. We are really capturing the client satisfaction part of the process, and we need to do a better job on the change in learning and change in action parts of the work.
Having done this exercise, I can clearly see that measuring reach and activity are perhaps the easiest things to measure. We have information tools at our fingertips to do this: online web mapping of participant zip-codes, google analytics to track website activity. Measuring the other impacts: change in action, contributions to policy and actual condition changes are tough. I think extension will continue to struggle with these, but they are critical to help us articulate our value to the public. More work to do!
References
Franz, Nancy K. 2011. “Advancing the Public Value Movement: Sustaining Extension During Tough Times.” Journal of Extension 49 (2): 2COM2.
———. 2014. “Measuring and Articulating the Value of Community Engagement: Lessons Learned from 100 Years of Cooperative Extension Work.” Journal of Higher Education Outreach and Engagement 18 (2): 5.
Rennekamp, Roger A., and Molly Engle. 2008. “A Case Study in Organizational Change: Evaluation in Cooperative Extension.” New Directions for Evaluation 2008 (120): 15–26.

Esri has been holding these Imagery and Mapping Forum days prior to the main UC. I was here for the day, as an invited panelist for the Executive Panel and Closing Remarks session on Sunday. During the day Ihung out in the Imaging and Innovation Zone, in front of the Drone Zone (gotta get one of these for ANR).
Notes from the day: Saw demos from a range of vendors, including:
- Aldo Facchin from Leica gave a slideshow about the Leica Pegasus: Backpack. Their backpack unit workflow uses SLAM; challenges include fusion of indoor and outdoor environments (from transportation networks above and below ground). Main use cases were industrial, urban, infrastructure. http://leica-geosystems.com/en-us/products/mobile-sensor-platforms/capture-platforms/leica-pegasus-backpack
- Jamie Ritche from Urthecast talked about "Bringing Imagery to Life". He says our field is "a teenager that needs to be an adult". By this he means that in many cases businesses don't know what they need to know. Their solution is in apps- "the simple and the quick": quick, easy, disposable and useful. 4 themes: revisit, coverage, time, quality. Their portfolio includes DEIMOS 1, Theia, Iris, DEIMOIS-2, PanGeo + . Deimos-1 focuses on agriculture. UrtheDaily: 5m pixels, 20TB daily, (40x the Sentinel output); available in 2019. They see their constellation and products as very comparable to Sentinel, Landsat, RapidEye. They've been working with Land O Lakes as their main imagery delivery. Stressing the ability of apps and cloud image services to deliver quick, meaningful information to users. https://www.urthecast.com/
- Briton Vorhees from SenseFly gave an overview of: "senseFly's Drone Designed Sensors". They are owned by Parrot, and have a fleet of fixed wing drones (e.g. the eBee models); also drone optimized cameras, shock-proof, fixed lens, etc (e.g. SODA). These can be used as a fleet of sensors (gave an citizen-science example from Zanzibar (ahhh Zanzibar)). They also use Sequoia cameras on eBees for a range of applications. https://www.sensefly.com/drones/ebee.html
- Rebecca Lasica and Jarod Skulavik from Harris Geospatial Solutions: The Connected Desktop". They showcased their new ENVI workflow implemented in ArcGIS Pro. Through a Geospatial Services Framework that "lifts" ENVI off the desktop; and creates an ENVI Engine. They showed some interesting crop applications - they call it "Crop Science". This http://www.harrisgeospatial.com/
- Jeff Cozart and McCain McMurray from Juniper Unmanned shared "The Effectiveness of Drone-Based Lidar" and talked about the advantages of drone-based lidar for terrain mapping and other applications. They talked through a few projects, and wanted to demonstrate the economies for drone-based lidar. The main advantages are in the data, not in the economics per se. They partner with Reigl and YellowScan from France. Showcased an example in Colorado between lidar (DJI Matrice was platform) and survey - the cost was 1/24th as expensive as the field survey. They did a live demo of some of the ArcGIS tools: classification of ground, feature extraction, etc. http://juniperunmanned.com/
- Aerial Imaging Productions talked about their indoor scanning - this linking indoor to outdoor - making data truly geo - is a big theme here. Also OBJ is a data format. From Wikipedia: "The OBJ file format is a simple data-format that represents 3D geometry alone — namely, the position of each vertex, the UV position of each texture coordinate vertex, vertex normals, and the faces that make each polygon defined as a list of vertices, and texture vertices." Used for 3D graphics, but increasingly for indoor point clouds in our field.
- My-Linh Truong from Reigl talked about their new static, mobile, airborne, uav lidar platforms. They've designed some mini lidar sensors for smaller UAVas (3lbs; 100kHz; 250m range; ~40pts/m2). Their ESRI workflow is called LMAP, and it relies on some proprietary REIGL software processing at the front end, then transfer to ArcGIS Pro (I think). http://www.rieglusa.com/index.html
We wrapped up the day with a panel discussion, moderated by Esri's Kurt Schwoppe, and including Lawrie Jordan from Esri, Greg Koeln from MDA, Dustin Gard-Weiss from NGA, Amy Minnick from DigitalGlobe, Hobie Perry from USFS-FIA, David Day from PASCO, and me. We talked about the promise and barriers associated with remote sensing and image processing from all of our perspectives. Some fun things that came out of the panel discussion were:
- Lawrie Jordan started Erdas!
- Digital Globe launched their 30cm resolution WorldView-4. One key case study was a partnership with Associated Press to find a pirate fishing vessel in action in Indonesia. They found it, and busted it, and found on board 2,000 slaves.
- The FIA is increasingly working on understanding uncertainty in their product, and they are moving for an image-base to a raster-based method for stratification.
- Greg Koeln, from MDA (he of the rad tie) says: "I'm a fan of high resolution imagery...but the world is a big place".
- Multi=sensor triangulation (or georeferencing a stack of imagery from multiple sources to you and me) is a continual problem, and its going to get worse before it gets better with more imagery from UAVs. On that note, Esri bought the patent for "SIFT" an automated tool for relative registration of an image stack.
- Space Junk!
Notes and stray thoughts:
- Esri puts on a quality show always. San Diego always manages to feel simultaneously busy and fun, while not being crowded and claustrophobic. Must be the ocean or the air.
- Gotta get behind the ubiquitous "analytics" replacement of "analysis" in talks. I am not convinced everyone is using the term correctly, but hey, it's a thing now: https://en.wikipedia.org/wiki/Analytics#Analytics_vs._analysis
- 10 years ago I had a wonderful visitor to my lab from Spain - Francisco Javier Lozano - and we wrote a paper: http://www.sciencedirect.com/science/article/pii/S003442570700243X. He left to work at some crazy company called Deimos in Spain, and Lo and Behold, he is still there, and the company is going strong. The Deimos satellites are part of the UrtheCast fleet. Small world!
- The gender balance at the Imagery portion of the Esri UC is not. One presenter at a talk said to the audience with a pointed stare at me: "Thanks for coming Lady and Gentlemen".
Good fun! Now more from Shane and Robert at the week-long Esri UC!


UC ANR was a sponsor for the FOODIT: Fork to Farm meeting in June 2017: http://mixingbowlhub.com/events/food-fork-farm/. Many of us were there to learn about what was happening in the food-data-tech space and learn how UCANR can be of service. It was pretty cool. First, it was held in the Computer History Museum, which is rad. Second, the idea of the day was to link partners, industry, scientists, funders, and foodies, around sustainable food production, distribution, and delivery. Third, there were some rad snacks (pic below).
We had an initial talk from Mikiel Bakker from Google Food, who have broadened their thinking about food to include not just feeding Googlers, but also the overall food chain and food system sustainability. They have developed 5 "foodshots" (i.e. like "moonshot" thinking): 1) enable individuals to make better choices, 2) shift diets, 3) food system transparency, 4) reduce food losses, and 5) how to make a closed, circular food system.
We then had a series of moderated panels.
The Dean's List introduced a panel of University Deans, moderated by very own Glenda Humiston @UCANR, and included Helene Dillard (UCDavis), Andy Thulin (CalPoly), Wendy Wintersteen (Iowa State). Key discussion points included lack of food system transparency, science communication and literacy, making money with organics, education and training, farm sustainability and efficiency, market segmentation (e.g. organics), downstream processing, and consumer power to change food systems. Plus the Amazon purchase of Whole Foods.
The Tech-Enabled Consumer session featured 4 speakers from companies who feature tech around food. Katie Finnegan from Walmart, David McIntyre from Airbnb, Barbara Shpizner from Mattson, Michael Wolf from The Spoon. Pretty neat discussion around the way these diverse companies use tech to customize customer experience, provide cost savings, source food, contribute to a better food system. 40% of food waste is in homes, another 40% is in the consumer arena. So much to be done!
The session on Downstream Impacts for the Food Production System featured Chris Chochran from ReFed @refed_nowaste, Sabrina Mutukisna from The Town Kitchen @TheTownKitchen, Kevin Sanchez from the Yolo Food Bank @YoloFoodBank, and Justin Siegel from UC Davis International Innovation and Health. We talked about nutrition for all, schemes for minimizing food waste, waste streams, food banks, distribution of produce and protein to those who need them (@refed_nowaste and @YoloFoodBank), creating high quality jobs for young people of color in the food business (@TheTownKitchen), the amount of energy that is involved in the food system (David Lee from ARPA-E); this means 7% of our energy use in the US goes to CREATING FOOD WASTE. Yikes!
The session on Upstream Production Impacts from New Consumer Food Choices featured Ally DeArman from Food Craft Institute @FoodCraftInst, Micke Macrie from Land O' Lakes, Nolan Paul from Driscoll's @driscollsberry, and Kenneth Zuckerberg from Rabobank @Rabobank. This session got cut a bit short, but it was pretty interesting. Especially the Food Craft Institute, whose mission is to help "the small guys" succeed in the food space.
The afternoon sessions included some pitch competitions, deep dive breakouts and networking sessions. What a great day for ANR.


First of all, Pearl Street Mall is just as lovely as I remember, but OMG it is so crowded, with so many new stores and chains. Still, good food, good views, hot weather, lovely walk.
Welcome to Day 2! http://neondataskills.org/data-institute-17/day2/
Our morning session focused on reproducibility and workflows with the great Naupaka Zimmerman. Remember the characteristics of reproducibility - organization, automation, documentation, and dissemination. We focused on organization, and spent an enjoyable hour sorting through an example messy directory of misc data files and code. The directory looked a bit like many of my directories. Lesson learned. We then moved to working with new data and git to reinforce yesterday's lessons. Git was super confusing to me 2 weeks ago, but now I think I love it. We also went back and forth between Jupyter and python stand alone scripts, and abstracted variables, and lo and behold I got my script to run.
The afternoon focused on Lidar (yay!) and prior to coding we talked about discrete and waveform data and collection, and the opentopography (http://www.opentopography.org/) project with Benjamin Gross. The opentopography talk was really interesting. They are not just a data distributor any more, they also provide a HPC framework (mostly TauDEM for now) on their servers at SDSC (http://www.sdsc.edu/). They are going to roll out a user-initiated HPC functionality soon, so stay tuned for their new "pluggable assets" program. This is well worth checking into. We also spent some time live coding with Python with Bridget Hass working with a CHM from the SERC site in California, and had a nerve-wracking code challenge to wrap up the day.
Fun additional take-home messages/resources:
- ISO International standard for dates = YYYY-MM-DD
- Missing values in R = NA, in Python = -9999
- For cleaning messy data - check out OpenRefine - a FOS tool for cleaning messy data http://openrefine.org/
- Excel is cray-cray, best practices for spreadsheets: http://www.datacarpentry.org/spreadsheet-ecology-lesson/
- Morpho (from DataOne) to enter metadata: https://www.dataone.org/software-tools/morpho
- Pay attention to file size with your git repositories - check out: https://git-lfs.github.com/. Git is good for things you do with your hands (like code), not for large data.
- Funny how many food metaphors are used in tech teaching: APIs as a menu in a restaurant; git add vs git commit as a grocery cart before and after purchase; finding GIS data is sometimes like shopping for ingredients in a specialty grocery store (that one is mine)...
- Markdown renderer: http://dillinger.io/
- MIT License, like Creative Commons for code: https://opensource.org/licenses/MIT
- "Jupyter" means it runs with Julia, Python & R, who knew?
- There is a new project called "Feather" that allows compatibility between python and R: https://blog.rstudio.org/2016/03/29/feather/
- All the NEON airborne data can be found here: http://www.neonscience.org/data/airborne-data
- Information on the TIFF specification and TIFF tags here: http://awaresystems.be/, however their TIFF Tag Viewer is only for windows.
Thanks for everyone today! Megan Jones (our fearless leader), Naupaka Zimmerman (Reproducibility), Tristan Goulden (Discrete Lidar), Keith Krause (Waveform Lidar), Benjamin Gross (OpenTopography), Bridget Hass (coding lidar products).

Our home for the week

I left Boulder 20 years ago on a wing and a prayer with a PhD in hand, overwhelmed with bittersweet emotions. I was sad to leave such a beautiful city, nervous about what was to come, but excited to start something new in North Carolina. My future was uncertain, and as I took off from DIA that final time I basically had Tom Petty's Free Fallin' and Learning to Fly on repeat on my walkman. Now I am back, and summer in Boulder is just as breathtaking as I remember it: clear blue skies, the stunning flatirons making a play at outshining the snow-dusted Rockies behind them, and crisp fragrant mountain breezes acting as my Madeleine. I'm back to visit the National Ecological Observatory Network (NEON) headquarters and attend their 2017 Data Institute, and re-invest in my skillset for open reproducible workflows in remote sensing.
Day 1 Wrap Up from the NEON Data Institute 2017
What a day! http://neondataskills.org/data-institute-17/day1/
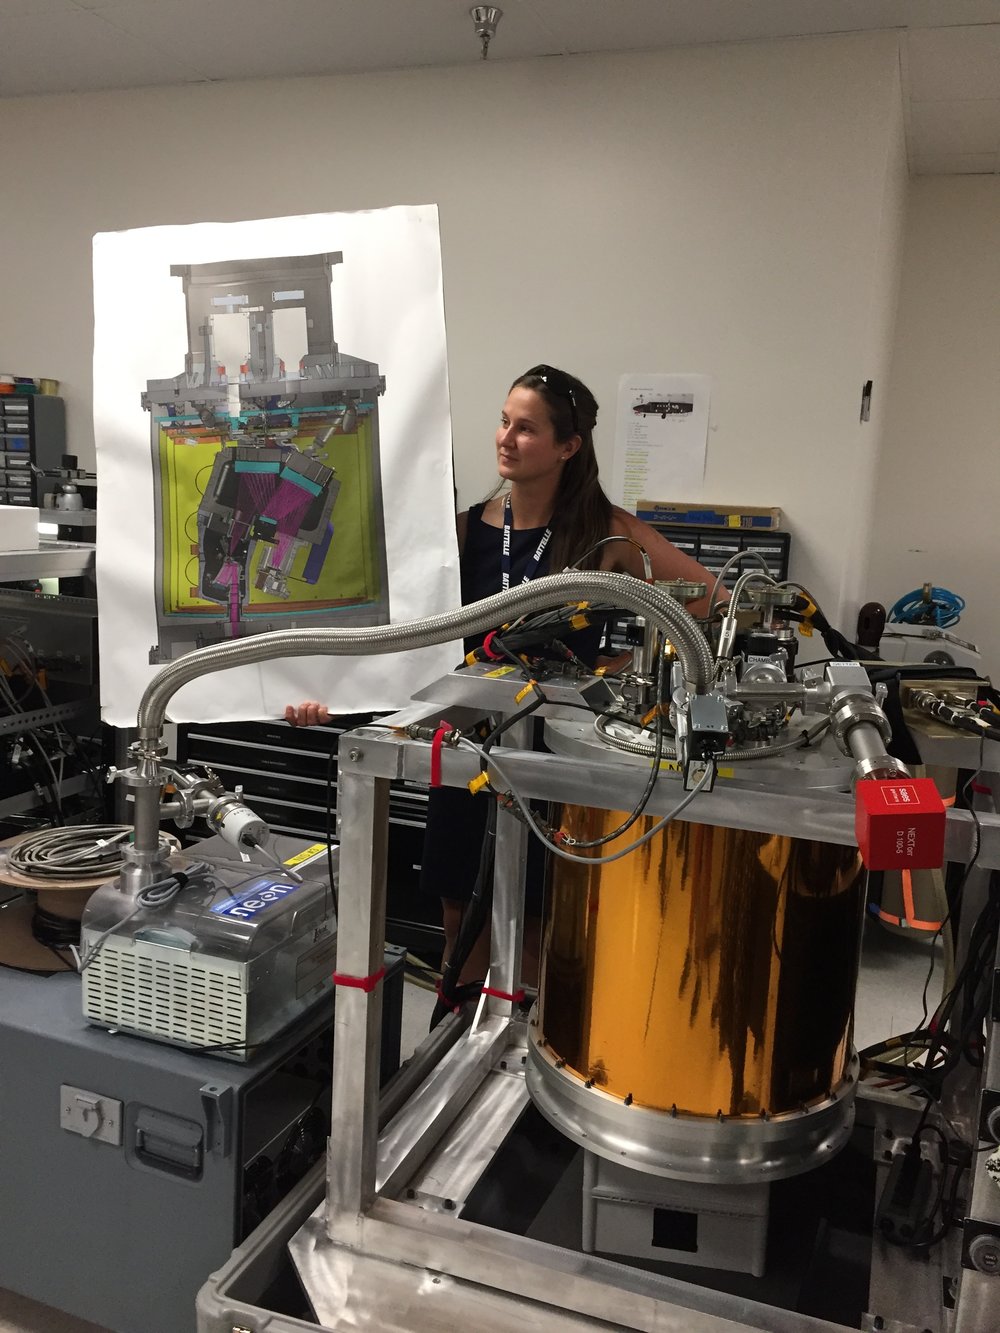
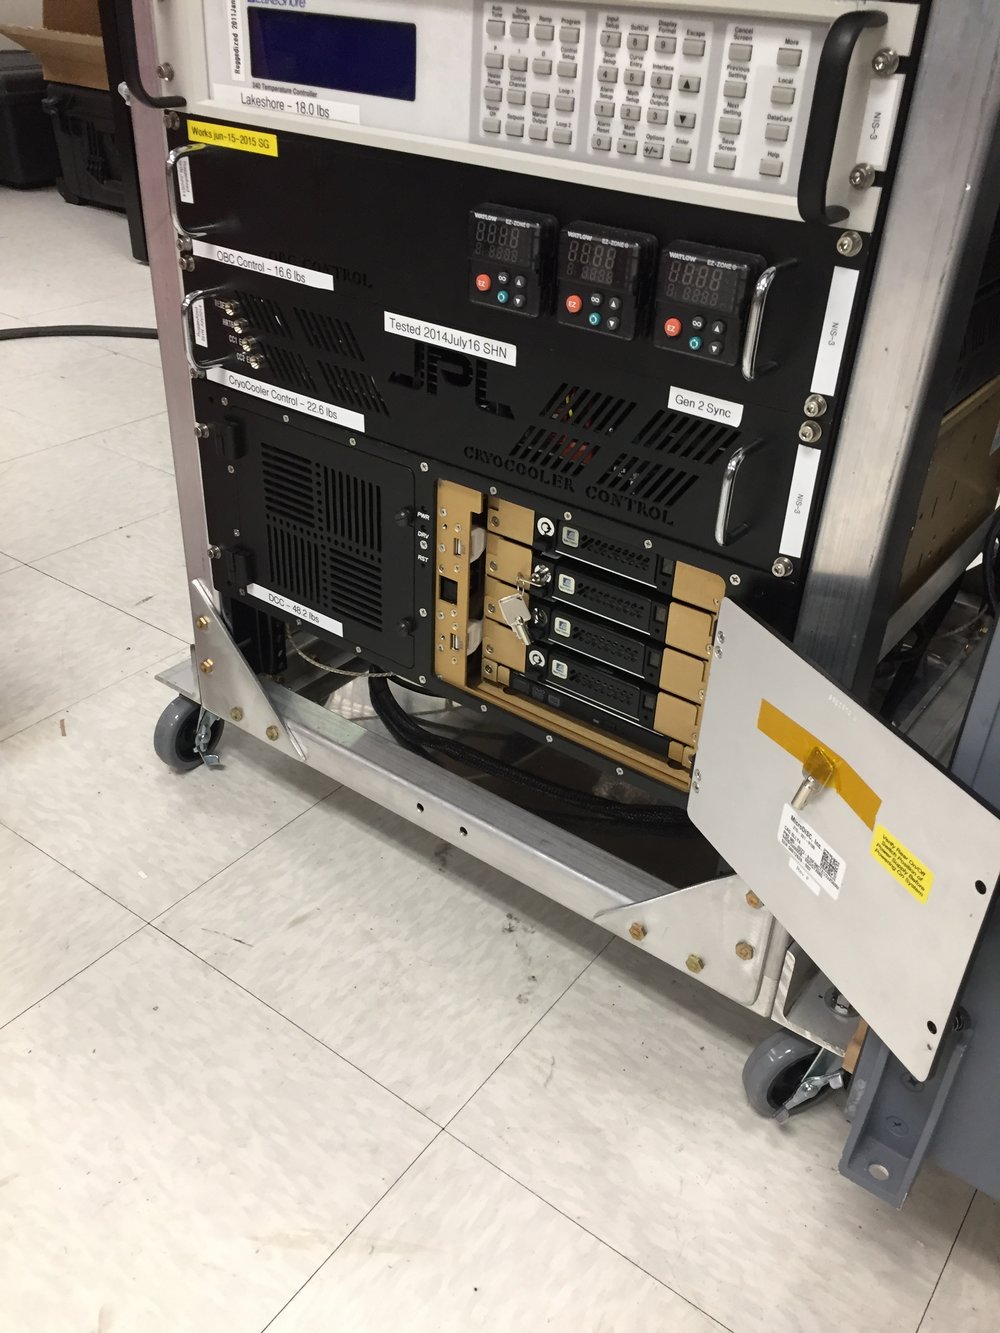
Attendees (about 30) included graduate students, old dogs (new tricks!) like me, and research scientists interested in developing reproducible workflows into their work. We are a mix of ages and genders. The morning session focused on learning about the NEON program (http://www.neonscience.org/): its purpose, sites, sensors, data, and protocols. NEON, funded by NSF and managed by Battelle, was conceived in 2004 and will go online for a 30-year mission providing free and open data on the drivers of and responses to ecological change starting in Jan 2018. NEON data comes from IS (instrumented systems), OS (observation systems), and RS (remote sensing). We focused on the Airborne Observation Platform (AOP) which uses 2, soon to be 3 aircraft, each with a payload of a hyperspectral sensor (from JPL, 426, 5nm bands (380-2510 nm), 1 mRad IFOV, 1 m res at 1000m AGL) and lidar (Optech and soon to be Riegl, discrete and waveform) sensors and a RGB camera (PhaseOne D8900). These sensors produce co-registered raw data, are processed at NEON headquarters into various levels of data products. Flights are planned to cover each NEON site once, timed to capture 90% or higher peak greenness, which is pretty complicated when distance and weather are taken into account. Pilots and techs are on the road and in the air from March through October collecting these data. Data is processed at headquarters.
In the afternoon session, we got through a fairly immersive dunk into Jupyter notebooks for exploring hyperspectral imagery in HDF5 format. We did exploration, band stacking, widgets, and vegetation indices. We closed with a fast discussion about TGF (The Git Flow): the way to store, share, control versions of your data and code to ensure reproducibility. We forked, cloned, committed, pushed, and pulled. Not much more to write about, but the whole day was awesome!
Fun additional take-home messages:
- NEON is amazing. I should build some class labs around NEON data, and NEON classroom training materials are available: http://www.neonscience.org/resources/data-tutorials
- Making participants do organized homework is necessary for complicated workshop content: http://neondataskills.org/workshop-event/NEON-Data-Insitute-2017
- HDF5 as an possible alternative data format for Lidar - holding both discrete and waveform
- NEON imagery data is FEDExed daily to headquarters after collected
- I am a crap python coder
- #whofallsbehindstaysbehind
- Tabs are my friend
Thanks to everyone today, including: Megan Jones (Main leader), Nathan Leisso (AOP), Bill Gallery (RGB camera), Ted Haberman (HDF5 format), David Hulslander (AOP), Claire Lunch (Data), Cove Sturtevant (Towers), Tristan Goulden (Hyperspectral), Bridget Hass (HDF5), Paul Gader, Naupaka Zimmerman (GitHub flow).