
The Fall 2020 UC Berkeley's Rausser College of Natural Resources Sponsored Project for Undergraduate Research (SPUR) project “Mapping municipal funding for police in California” continued in Spring 2021. This semester we continued our work with Mapping Black California (MBC), the Southern California-based collective that incorporates technology, data, geography, and place-based study to better understand and connect African American communities in California. Ben Satzman, lead in the Fall, was joined by Rezahn Abraha. Together they dug into the data, found additional datasets that helped us understand the changes in police funding from 2014 to 2019 in California and were able to dig into the variability of police spending across the state. Read more below, and here is the Spring 2021 Story Map: How Do California Cities Spend Money on Policing? Mapping the variability of police spending from 2014-2019 in 476 California Cities.
This semester we again met weekly and used data from 476 cities across California detailing municipal police funding in 2014 and 2019. By way of background, California has nearly 500 incorporated cities and most municipalities have their own police departments and create an annual budget determining what percentage their police department will receive. The variability in police spending across the state is quite surprising. In 2019 the average percentage of municipal budgets spent on policing is about 20%, and while some municipalities spent less than 5% of their budgets on policing, others allocated more than half of their budgets to their police departments. Per capita police spending is on average about $500, but varies largely from about $10 to well over $2,000.
We set out to see how police department spending changed from 2014 to 2019, especially in relation to population changes from that same 5-year interval. We used the California State Controller's Finance Data to find each city's total expenditures and police department expenditures from 2014 and 2019. This dataset also had information about each city's total population for these given years. We also used a feature class provided by CalTrans that had city boundary GIS data for all incorporated municipalities in California.
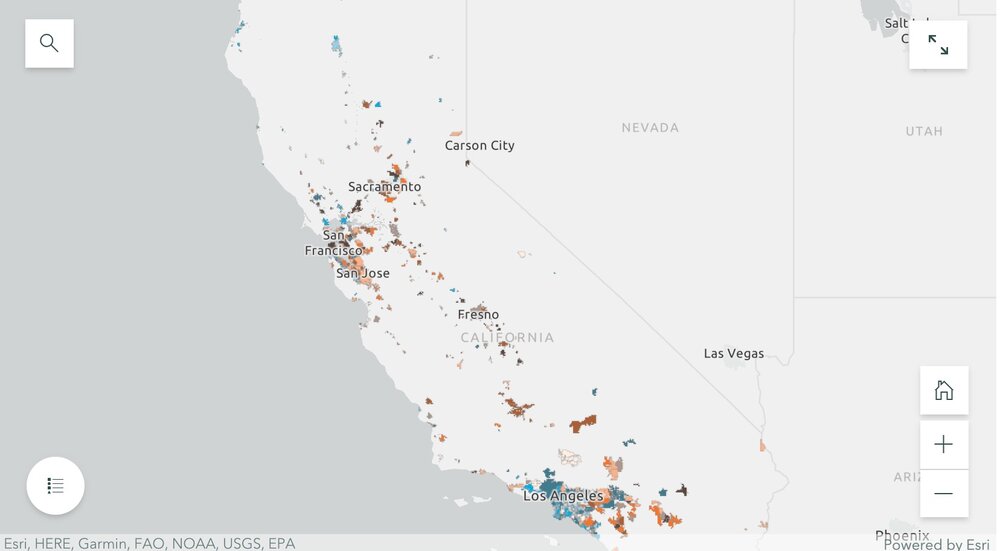
By dividing the police department expenditures by the total city expenditures for both 2014 and 2019, we were able to create a map showing what percentage of their municipal budgets 476 California cities were spending on policing. We were also able to visualize the percentage change in percentage police department spending and population from 2014 to 2019. Changes in police spending (and population change) were not at all consistent across the state. For example, cities that grew sometimes increased spending, but sometimes did not. Ben and Rezahn came up with a useful way of visualizing how police spending and population change co-vary (click on the map above to go to the site), and found 4 distinct trends in the cities examined:

-
Cities that increased police department (PD) spending, but saw almost no change in population (these are colored bright blue in the map);
-
Cities that saw increases in population, but experienced little or negative change in PD spending (these are bright orange in the map);
-
Cities that saw increases in both PD spending and population (these are dark brown in the map); and
-
Cities that saw little or negative change in both PD spending and population (these are cream in the map).
They then dug into southern California and the Bay Area, and selected mid-size cities that exemplified the four trends to tell more detailed stories. These included for the Bay Area: Vallejo (increased police department (PD) spending, but saw almost no change in population), San Ramon (increases in population, but experienced little or negative change in PD spending), San Francisco (increases in both PD spending and population) and South San Francisco (little or negative change in both PD spending and population); and for southern California: Inglewood (increased police department (PD) spending, but saw almost no change in population), Irvine (increases in population, but experienced little or negative change in PD spending), Palm Desert (increases in both PD spending and population), Simi Valley (little or negative change in both PD spending and population). Check out the full Story Map here, and read more about these individual cities.
The 5-year changes in municipal police department spending are challenging to predict. Cities with high population growth from 2014 to 2019 did not consistently increase percentage police department spending. Similarly, cities that experienced low or even negative population growths varied dramatically in percentage change police department spending. The maps of annual police department spending percentages and 5-year relationships allowed us to identify these complexities, and will be an important source of future exploration.
The analysts on the project were Rezahn Abraha, a UC Berkeley Conservation and Resource Studies Major, and Ben Satzman, a UC Berkeley Conservation and Resource Studies Major with minors in Sustainable Environmental Design and GIS. Both worked in collaboration with MBC and the Kellylab to find, clean, visualize, and analyze statewide data. Personnel involved in the project are: from Mapping Black California - Candice Mays (Partnership Lead), Paulette Brown-Hinds (Director), Stephanie Williams (Exec Editor, Content Lead), and Chuck Bibbs (Maps and Data Lead); from the Kellylab: Maggi Kelly (Professor and CE Specialist), Chippie Kislik (Graduate Student), Christine Wilkinson (Graduate Student), and Annie Taylor (Graduate Student).
We thank the Rausser College of Natural Resources who funded this effort.
Fall 2020 Story Map: Mapping Police Spending in California Cities. Examine Southern California and the Bay Area in detail, check out a few interesting cities, or search for a city and click on it to see just how much they spent on policing in 2017.
Spring 2021 Story Map: How Do California Cities Spend Money on Policing? Mapping the variability of police spending from 2014-2019 in 476 California Cities.

In September 2020, UC Berkeley’s Rausser College of Natural Resources selected the Kellylab for a Sponsored Project for Undergraduate Research (SPUR) project for their proposal entitled “Mapping municipal funding for police in California.” The project partnered with Mapping Black California (MBC), the Southern California-based collective that incorporates technology, data, geography, and place-based study to better understand and connect African American communities in California. We met weekly during the fall semester and gathered data from 472 cities across California, detailing the per-capita police funding and percent of municipal budget that is spent on police departments. California has nearly 500 incorporated cities and most municipalities have their own police departments and create an annual budget determining what percentage their police department will receive. The variability in police spending across the state is quite surprising - check out the figures below. The average percentage of municipal budgets spent on policing is about 20%, and while some municipalities spent less than 5% of their budgets on policing, others allocated more than half of their budgets to their police departments. Per capita police spending is on average about $500, but varies largely from about $10 to well over $2,000. If you are interested in this project, explore our findings through the Story Map: examine Southern California and the Bay Area in detail, check out a few interesting cities, or search for a city and click on it to see just how much they spent on policing in 2017.
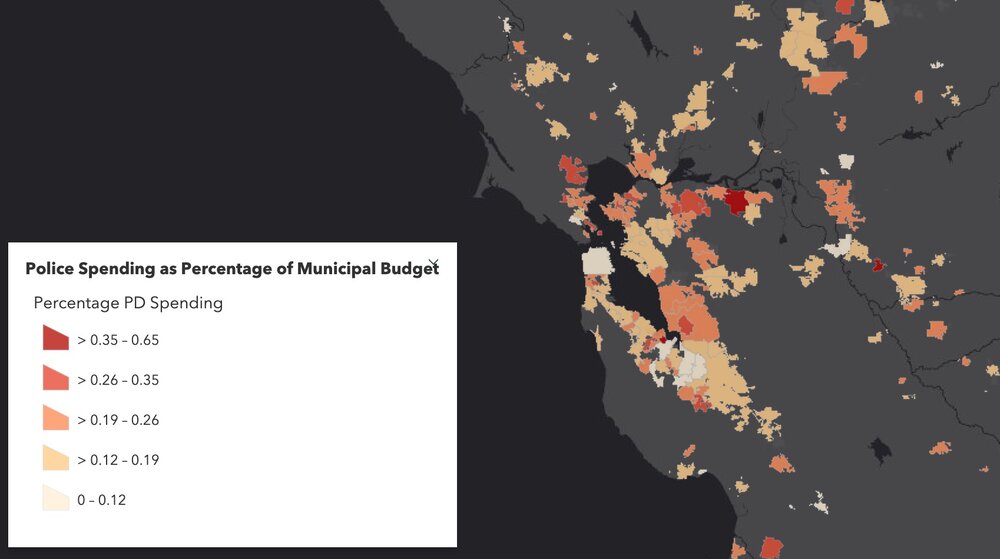
Figure showing variability in Police Spending (% of municipal budget) in Northern California in 2017. Data from California State Controller's Cities Finances Data, 2017 (City and police spending information). For more information see the Story Map here.
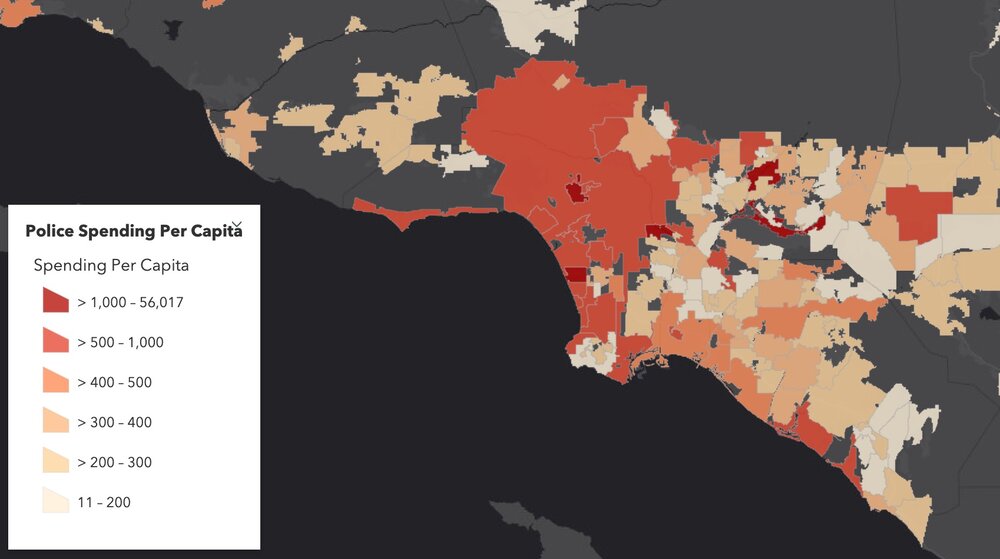
Figure showing variability in Police Spending (PEr capita) in Northern California in 2017. Data from California State Controller's Cities Finances Data, 2017 (City and police spending information). For more information see the Story Map here.
The analyst on the project has been Ben Satzman, a UC Berkeley Conservation and Resource Studies Major with minors in Sustainable Environmental Design and GIS, who worked in collaboration with MBC and the Kellylab to find, clean, visualize, and analyze statewide data. We plan on continuing the project to explore the possible influences (such as racial diversity, crime, poverty, ethnicity, income, and education) underlying these regional trends and patterns in police spending. Personnel involved in the project are: from Mapping Black California - Candice Mays (Partnership Lead), Paulette Brown-Hinds (Director), Stephanie Williams (Exec Editor, Content Lead), and Chuck Bibbs (Maps and Data Lead); from the Kellylab: Maggi Kelly (Professor and CE Specialist), Chippie Kislik (Graduate Student), Christine Wilkinson (Graduate Student), and Annie Taylor (Graduate Student).
We thank the Rausser College of Natural Resources who funded this effort.

I left Boulder 20 years ago on a wing and a prayer with a PhD in hand, overwhelmed with bittersweet emotions. I was sad to leave such a beautiful city, nervous about what was to come, but excited to start something new in North Carolina. My future was uncertain, and as I took off from DIA that final time I basically had Tom Petty's Free Fallin' and Learning to Fly on repeat on my walkman. Now I am back, and summer in Boulder is just as breathtaking as I remember it: clear blue skies, the stunning flatirons making a play at outshining the snow-dusted Rockies behind them, and crisp fragrant mountain breezes acting as my Madeleine. I'm back to visit the National Ecological Observatory Network (NEON) headquarters and attend their 2017 Data Institute, and re-invest in my skillset for open reproducible workflows in remote sensing.
Day 1 Wrap Up from the NEON Data Institute 2017
What a day! http://neondataskills.org/data-institute-17/day1/
Attendees (about 30) included graduate students, old dogs (new tricks!) like me, and research scientists interested in developing reproducible workflows into their work. We are a mix of ages and genders. The morning session focused on learning about the NEON program (http://www.neonscience.org/): its purpose, sites, sensors, data, and protocols. NEON, funded by NSF and managed by Battelle, was conceived in 2004 and will go online for a 30-year mission providing free and open data on the drivers of and responses to ecological change starting in Jan 2018. NEON data comes from IS (instrumented systems), OS (observation systems), and RS (remote sensing). We focused on the Airborne Observation Platform (AOP) which uses 2, soon to be 3 aircraft, each with a payload of a hyperspectral sensor (from JPL, 426, 5nm bands (380-2510 nm), 1 mRad IFOV, 1 m res at 1000m AGL) and lidar (Optech and soon to be Riegl, discrete and waveform) sensors and a RGB camera (PhaseOne D8900). These sensors produce co-registered raw data, are processed at NEON headquarters into various levels of data products. Flights are planned to cover each NEON site once, timed to capture 90% or higher peak greenness, which is pretty complicated when distance and weather are taken into account. Pilots and techs are on the road and in the air from March through October collecting these data. Data is processed at headquarters.
In the afternoon session, we got through a fairly immersive dunk into Jupyter notebooks for exploring hyperspectral imagery in HDF5 format. We did exploration, band stacking, widgets, and vegetation indices. We closed with a fast discussion about TGF (The Git Flow): the way to store, share, control versions of your data and code to ensure reproducibility. We forked, cloned, committed, pushed, and pulled. Not much more to write about, but the whole day was awesome!
Fun additional take-home messages:
- NEON is amazing. I should build some class labs around NEON data, and NEON classroom training materials are available: http://www.neonscience.org/resources/data-tutorials
- Making participants do organized homework is necessary for complicated workshop content: http://neondataskills.org/workshop-event/NEON-Data-Insitute-2017
- HDF5 as an possible alternative data format for Lidar - holding both discrete and waveform
- NEON imagery data is FEDExed daily to headquarters after collected
- I am a crap python coder
- #whofallsbehindstaysbehind
- Tabs are my friend
Thanks to everyone today, including: Megan Jones (Main leader), Nathan Leisso (AOP), Bill Gallery (RGB camera), Ted Haberman (HDF5 format), David Hulslander (AOP), Claire Lunch (Data), Cove Sturtevant (Towers), Tristan Goulden (Hyperspectral), Bridget Hass (HDF5), Paul Gader, Naupaka Zimmerman (GitHub flow).


Today we had our 1st Data Science for the 21st Century Program Conference. Some cool things that I learned:
- Cathryn Carson updated us on the status of the Data Science program on campus - we are teaching 1200 freshman data science right now. Amazing. And a new Dean is coming.
- Phil Stark on the danger of being at the bleeding edge of computation - if you put all your computational power into your model, you have nothing left to evaluate uncertainty in your model. Let science guide data science.
- David Ackerly believes in social networking!
- Cheryl Schwab gave us an summary of her evaluation work. The program outcomes that we are looking for in the program are: Concepts, communication, interdisciplinary research
- Trevor Houser from the Rhodian Group http://rhg.com/people/trevor-houser gave a very interesting and slightly optimistic view of climate change.
- Break out groups, led by faculty:
- (Boettiger) Data Science Grand Challenges: inference vs prediction; dealing with assumptions; quantifying uncertainty; reproducibility, communication, and collaboration; keeping science in data science; and keeping scientists in data science.
- (Hsiang) Civilization collapses through history:
- (Ackerly) Discussion on climate change and land use. 50% of the earth are either crops or rangelands; and there is a fundamental tradeoff between land for food and wildlands. How do we deal with the externalities of our love of open space (e.g. forcing housing into the central valley).
- Finally, we wrapped up with presentations from our wonderful 1st cohort of DS421 students and their mini-graduation ceremony.
- Plus WHAT A GREAT DAY! Berkeley was splendid today in the sun.

They say:
Are you a college student, researcher or professor? We’re looking for innovative academics, researchers and scientists to unlock the power of a one-of-a-kind dataset. You can now apply for access to Planet’s unique dataset for non-commercial research purposes. In an area as large as 2,000 square kilometers, you’ll have access to download imagery, analyze trends, and publish your results.
Check it: https://www.planet.com/products/education-and-research/

