- Author: Andy Lyons
- Contributor: Shane Feirer

Fortunately the tools of the trade are keeping up, allowing us to manage and utilize data more efficiently and effectively than ever before. And there's no better place to see what's out there than the annual UC Love Data Week, February 14-18, 2022.
UC Love Data Week is a week-long series of data themed workshops held annually around Valentines Day. This year, data scientists, librarians, and instructors from 9 of the ten UC Campuses are teaching workshops on a wide range of data topics. IGIS is pleased to represent UC ANR for the first time ever, joining the fray with two of our newer workshops on working with Cal-Adapt climate data in R (2/17/22) , and analyzing spatial data using Python Notebooks in ArcGIS Pro (2/18/22).
Other workshops this year run the gamut from data ethics and justice, to developing a data management plan for your proposal, to a data feminism book club meeting. And many others. All are free and open to all UC affiliates. Check out the complete offerings on the UC Love Data website.
- Author:
Annie Taylor
- Editor: Andy Lyons
by Annie Taylor

If you attended any of the Google Earth Engine workshops I've led with IGIS, then you know that I love talking about the tool and hearing what others are doing with it. Last month, I attended my fifth Geo for Good Summit, which is quite possibly my favorite annual event. I'll provide a recap of the event and some of my highlights, and then links for you to check out the summit for yourself or explore other resources.
Google's Geo for Good Summit is an annual conference where folks from nonprofits, government agencies, and scientists hear about the latest updates to Google's mapping tools and get to share their work with each other. Geo for Good, also abbreviated as G4G, has been held since 2012 and was an in-person Bay Area conference until 2020, when it was first held virtually. G4G continued in that virtual format in 2021, with some exciting twists on the usual virtual format.
G4G always kicks off with an inspiring community video that showcases different people and use cases, and this year was no exception.
Next, we got updates on the latest improvements to Google's geospatial tools, which is my personal favorite session. Here's a rough summary of my highlights.
What's new in Google Earth?
In case you haven't heard, Google Earth is now a gorgeous web application. Google Earth Pro (the desktop application) is still supported as they migrate all of its tools and functionality to the web version. There's also a mobile application for your phone! These updates relate to the web application:
- You can now export tile overlays from EE and import them into Earth so that they drape on top of the 3D planet – very cool visualization for your data.
- You can collaborate on Earth projects just like you would a Google Doc using the Cloud Project option.
- The date of the basemap imagery (when available) now pops up when you move your cursor. Also, the scale bar shows the scale bar relative to where your cursor is, which is a great addition for 3D viewing.
What's new in Earth Engine?
- Landsat and Sentinel images are now ingested and loaded into EE in under 12 hours from their capture – enabling near real time analysis in EE.
- The Dynamic World dataset – a global land cover probability map at 10m resolution available every five days from 2017 to 2021 – will soon be available in the EE Data Catalog.
- Additions to the API (new machine learning models)
- Additions to the Data Catalog and more Python API example scripts
Other Geospatial Tools by Google
I won't go into these here, so check out the recorded sessions for more information:
- Google My Maps
- Google Earth Studio
- Google Street View and Maps API
G4G was very creative in their approach to the virtual conference. For example, they organized poster sessions and virtual mingling in a custom space they created using Gather, where you could see and hear the people ‘nearest' to you in the ‘room.' They also hosted user-created Meet Ups, where members of the community can break off to talk about their specific application, tool, or part of the world. A final highlight of the conference were the Office Hours hosted by the engineers working on each of these tools, which is an incredible opportunity to talk through your specific idea or challenge.
If you missed it, you can find all of the recorded sessions on the conference website or on Google Earth Outreach's YouTube site, which are both linked below.
I hope to see you next fall at G4G 2022!
Annie

Conference Website (with recordings)
Geo for Good YouTube Channel Playlist
Earth and Earth Engine Blog
- Author: Andy Lyons
The Magic Behind Cal-Adapt: The API
If you're reading this you've probably heard of Cal-Adapt, California's official source for downscaled climate data from the 4th Climate Change Assessment. Most people have engaged with climate data on Cal-Adapt through the website, which provides over a dozen well-designed interactive tools that allow you to create charts and maps of wide range of climate variables, from temperature to snow pack to wildfire risk, for your location of interest. For the intrepid user, the website also has a download tool where you can download the data as CSV or raster files, or the source files in NetCDF format.
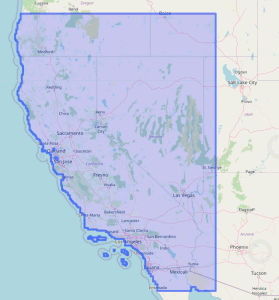
Cal-Adapt provides access to a wealth of downscaled climate data for
California, Nevada, and parts of neighboring states
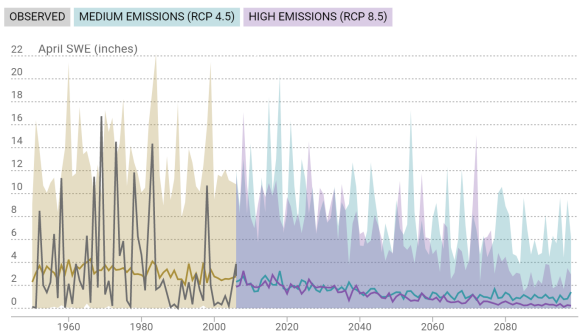
Sample chart from Cal-Adapt.org
A lesser known fact is that all this magic is made possible under the hood by a well-designed open API. An API, or Application Programming Interface, is essentially a common language that allows computer programs to talk to each other. Using the API, the Cal-Adapt website can retrieve data from the Cal-Adapt server, on demand, to make all those beautiful charts and maps.
But guess what? This same API, which is fully open and documented on the Cal-Adapt website, can be used by things other than websites. Any programming language that supports standard web protocols can send specially formatted commands through the API to get climate data directly from Cal-Adapt, without ever having to go through the website. This includes R and Python, the two most popular programming languages for data science, with users in the hundreds of thousands.
Introducing caladaptR

Why is this a big deal, you might ask? We can start with the huge number of R users, particularly in research and academia. The science of climate change impacts and adaptation planning are still young and rapidly evolving, and R is by far the favorite computing environment for researchers. Before caladaptR, a data scientist would need to go through the Cal-Adapt website and download the raw data as rasters or CSV files, one variable at a time, and one zip file at a time. She would then have to import those files into R using the file names as a reminder of which data it contains. This process works, and many people have done, but it's time consuming and klunky. caladaptR replaces all of those manual steps with a few lines of code that can be easily tweaked for new locations, climate variables, and models.
For civilians out there, this is still a big deal because it means adaptation planners and researchers can not only work more efficiently, they can also package up their analyses in user-friendly output formats that R is really good at. This includes markdown reports, as well as tailored decision support tools.
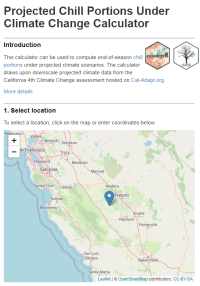 One of R's most popular features is R-Shiny, a package which allows R users to bundle their analyses up into user friendly interactive web sites, or apps. These web apps aren't limited to show pre-canned results, they can actually fetch data "on the fly" and run analyses based on user input. caladaptR is a "Shiny ready" package that includes a widget to show your data download status. A couple of sample Shiny apps are available on the website, including one that computes the projected amount of winter chill in the coming decades, which can help tree crop growers decide which variety of tree nuts to plant, or whether to get out of tree nuts all together.
Not surprisingly, we've recently seen growing interest in climate change impacts, and a growing recognition that data from climate models need to be transformed into measures that make sense to regular folks. Data science platforms like R, that can tap into cloud data and services via APIs, are the kinds of tools that will build the next generation of climate science translation services. With R and caladaptR, analyzing climate impacts and developing decision support tools is well within reach of anyone who has intermediate R skills.
Learning More
For more details, check out the following overview videos. When you're ready to start writing some code, head over to the caladaptR website which has installation instructions, getting started code, sample notebooks, workshop recordings, and long-form articles on some of the more advanced features. You can also attend an upcoming workshop (the next caladaptR workshop will be February 2022) and sign-up for IGIS Office Hours if you have any questions.

- Author: Sean Hogan
- Author: Brandon Stark
- Author: Maggi Kelly

non-recreational use of small unmanned aerial systems (sUAS - aka. drones) was added to the FAA's Code of Federal Regulations (CFR) in mid-2016, there have been a number of updates to the rules over the years, including an Academic Exemption for education and research purposes (which is only apply to institutions of higher education and not other state agencies or conservation groups). The most recent of these updates occurred in January 2021, when the regulations were further amended to allow for the operation of drones during the night and over people in limited circumstances. For some operators, these have been very welcome changes. However, maybe more widely relevant to our community of drone enthusiasts, in June 2021 the FAA announced the requirement of "The Recreational UAS Safety Test" (TRUST) for all recreational pilots; with the objective of ensuring that these pilots are likewise knowledgeable in the FAA's rules and regulations for drone operations.
Amidst these updates and changes to the regulations, a common question that IGIS receives is "what do I need to do to legally fly a drone?" To answer this question, the head of our UC System's Center of Excellence on Unmanned Aircraft System Safety (UASSafety), Dr. Brandon Stark, has provided the following simplified guidelines to help steer people in the right directions, for whether they need the TRUST and/or Part 107 certifications:
- Coursework -> TRUST
- Research in access-controlled field -> TRUST
- Research in public area with people -> Part 107
- Collection of data for another agency -> Part 107
- Promotional media -> Part 107
- Demonstration for students -> TRUST
- Demonstration for non-students -> Part 107
- Inspecting any structure for repairs -> Part 107
- Flying above the FAA's Facility Map Altitude -> Part 107
- Flying above 400 ft (AGL) -> Part 107
- Any operation that could profit the pilot in any way -> Part 107
- Strictly for fun (even if you have a Part 107 certification) -> TRUST
Note - The Academic Exception is not a loophole. Everyone now needs to have either completed a TRUST or Part 107 certification, and preferably both.
For the sake of drone operators everywhere, it is extremely important that we all abide by these rules and regulations; as it could take only one grievous mistake (even if the mistake is unwitting) to legally set back all of the progress that has been made for the allowance of sUAS operations, both within and outside of the UC System.
For more information on the TRUST and Part 107 certifications, please refer to the FAA's official site: https://faadronezone.faa.gov/
For all UC drone operations, please do not forget to file your flights in advance through the UC's UAS Safety App, https://ehs.ucop.edu/drones/. This is not only required by the UC System, but also provides the valuable benefit of insurance coverage for you and your drone in the event of an accident. Additionally, the recently created UC Drones knowledge portal is an incredible resource for a wide range of drone safety and regulation information: https://ucdrones.github.io/

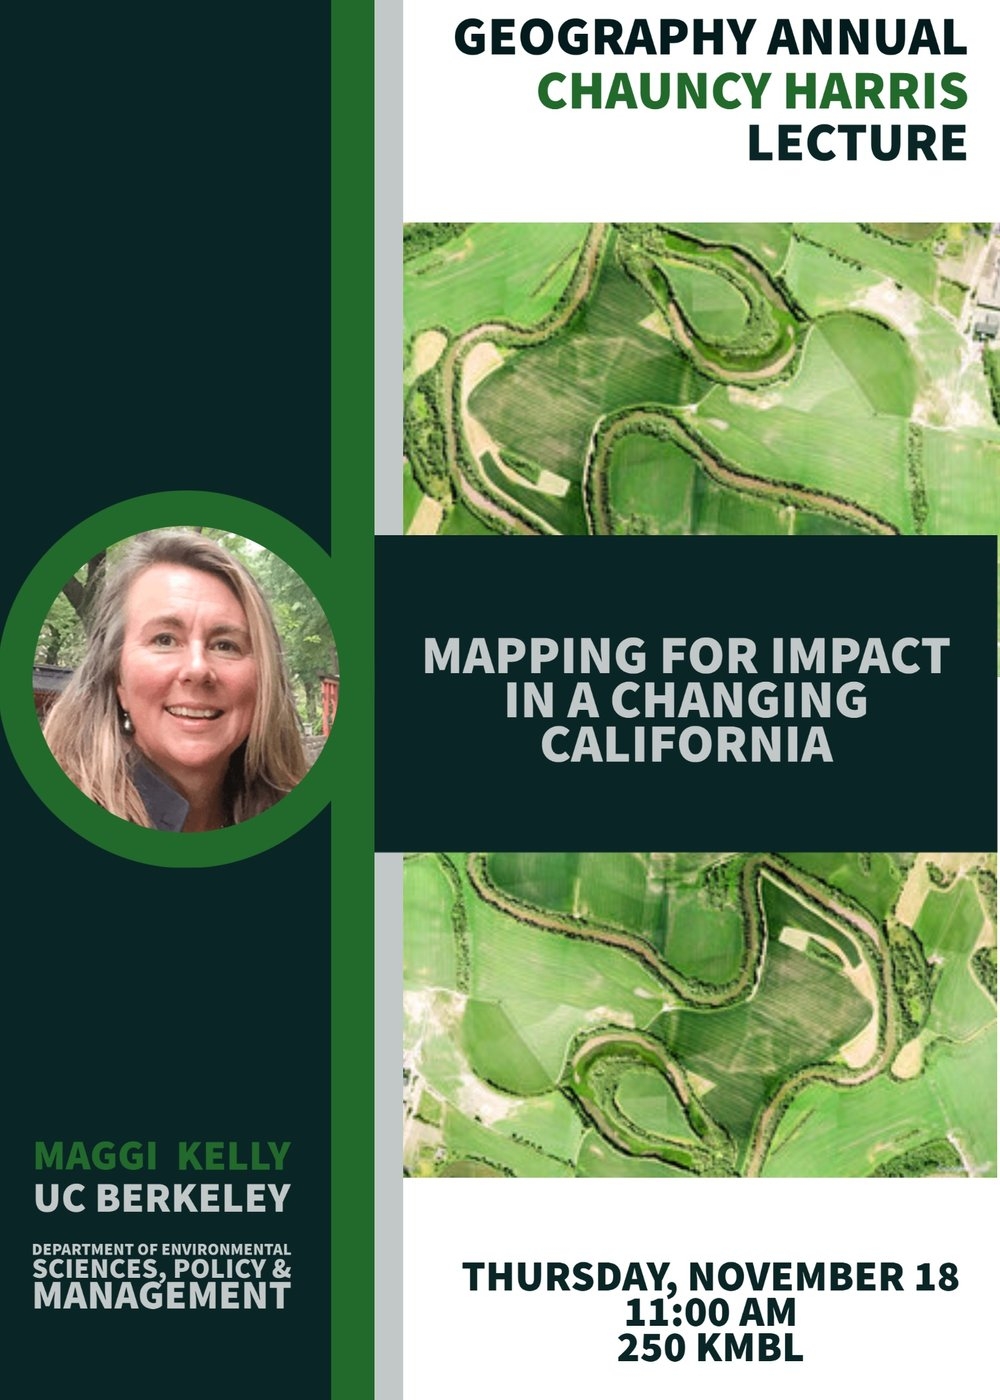
This week I am venturing out of California for a quick trip to Provo Utah and BYU to deliver the Chauncy Harris Lecture. Chauncy Harris was a pioneer of modern urban geography, with critical scholarship in urban form: "The Nature of Cities" and "A Functional Classification of Cities in the United States". He was a geographer, born in Utah, and every year the Geography Department at BYU hold a lecture in his honor. My buddy Ryan Jensen, son of the famous and fabulous John Jensen, invited me to give this year’s talk - so I am going!
I’ll be talking about my “Mapping for Impact” concept - and how we can use spatial data science to help tackle some of the thorny problems facing us today. I am going to highlight some of my lidar + forest work, the VTM historical ecology project, and of course, drones.
Check out this cute poster they put together for the talk.

