
- Author: Sean Hogan

It was a great pleasure to attend the first in-person event held by ESRI since the start of COVID-19 in 2020, the ESRI Imagery Summit. This event largely focused on ESRI's steady progress towards incorporating more tools for collection, analysis and visualization of remotely sensed data/imagery into both ESRI's online and offline applications.
Among the many topics presented at the summit, there were two topics that excited me the most. The first was “ESRI Image for ArcGIS Online”. This brand new add-on for ArcGIS Online promises to be an increadibly valuable resource for efficiently uploading, analyzing and visualizing your own imagery to ArcGIS Online. Currently, ArcGIS Online requires users to host their own imagery on either a server or in the cloud, which can be prohibitively difficult for some users, and then call this imagery into your ArcGIS Online maps. However, this add-on will allow you to directly upload your data to ArcGIS Online, where it will be hosted in ESRI's Amazon cloud (at a yet to be determined credit fee structure), where it can then very be efficiently analyzed and displayed in ArcGIS Online.
The second topic that excited me was ESRI's Site Scan applications. I say “applications” (plural) because there are two parts to Site Scan, which can be used independently, but can also be used together. One part is a drone flight app (referred to as Site Scan Flight Limited Addition), and one part a cloud processing app. The flight app might be the best drone flight planning app that I have ever seen for quadcopters (almost like Sensefly's e-Motion, my favorite flight planning app, but for quadcopters). The only down side that I can see for the Site Scan flight app is that it is only compatible with a limited number of drones. As for the cloud processing app, it is a little early to tell, but for GIS users I think that it might be the future of drone data stitching apps. In particular, I am excited about how nicely it integrates with ArcGIS Online, via ESRI's cloud storage, which could be incredibly efficient for the data management of ongoing drone projects; being one of the most challenging aspects of regular drone operations.
IGIS will continue to explore/follow these developments as they are forthcoming, and will update the IGIS Blog accordingly.
Sean Hogan


- Author: Sean Hogan
- Author:
Ben Satzman
- Author: Maggi Kelly
July 2021 marks the fifth anniversary of Drone Camp, and thanks to an all-star lineup of presenters and instructors and a fantastic and diverse group of over 255 attendees from all over the world, it was a massive success this year. Initially launched in 2016 by the UC ANR, IGIS Statewide program, DroneCamp has now evolved into a multi-campus and industry collaboration, with a network of drone experts hailing from UC ANR, UC Santa Cruz, UC Berkeley, UC Merced, UC Davis, CSU Monterey Bay, and the Monterey Bay Drone Automation and Robotics Technology corporation. From 2016 to 2019, this event was held in-person at Davis, San Diego, and then in Monterey, CA.; however, in 2020 it was moved online due to COVID-19. The move indoors, to discuss a very outdoor-oriented topic, came with some challenges. We had to shelve our important (and fun) hands-on equipment and flight training, for example. Yet it had rewards. We were able to reach a more diverse and a greater number of participants, and widen the scope of content. Ultimately, 2020 was a great success, but in the process we recognized that it could be even better with additional help from our network of drone expert friends from around the state.
Like last year, we came together online for DroneCamp 2021 in July. Over 255 people joined from around the world to learn about theory, application, regulation, and data processing. We learned about the practical aspects of maintaining safety while flying, we took deep dives into various software workflows, and explored agricultural, forestry, and vegetation mapping examples. This year we hosted 5 Plenary sessions, and had some electrifying plenary talk sessions from cutting-edge scientists from around California: Crashing drones! Precision Agriculture! Citizen Science! Mapping aquatic environments!
Because the overall objective of DroneCamp remains to provide the most practical and comprehensive learning experience possible for attendees, we are working on an in-person, hands-on training day that is being scheduled for October, to be held in Monterey/Marina California. And, as the threat of COVID-19 subsides, additional in-person training sessions will be added around the state of California in the coming year.

DroneCamp Overview:
DroneCamp is designed for a wide range of skill levels and interests, for those who are interested in using drones for anything other than non-recreation use (calling for a part 107 remote pilot's license), from complete beginners with little to no experience in drone technology, to intermediate users who want to learn more advanced data processing and analysis. Between presentations on contemporary applications of drones in environmental and agricultural research, and hands-on data processing and analysis exercises, attendees have the opportunity to fully immerse themselves in the following topics:
-
Flight Skills: Safe Launch and Landings, Basic Operations, Traversing and Avoiding Obstacles, Night Flying
-
Safety and Regulations: Safety and Regulations Overview; How to be a Good Visual Observer; Operating in Controlled Airspace
-
Hardware: Sensors, Platforms and Field Accessories
-
Data Collection: Mission Planning; High Precision Mapping
-
Data Processing: Stitching Drone Images with Pix4D, Agisoft Metashape, ArcGIS Pro, and OpenDroneMap; Analyzing Processed Drone Data in QGIS and ArcGIS Pro
-
Data Analysis and Management: Vegetation Analysis, Vegetation Analysis and Classification in ArcGIS Pro;Analysis of the Intertidal Zone; A case study of data management, from collection to storage and sharing of data outputs.
It was super fun and rewarding, and a great success for ANR and all the other collaborators. We built networks, increased collaboration, learned some very cool technical stuff, and got updated on current regulations, including the fact that you can now renew your 107 license easily here.
Some inspiring quotes from anonymous attendee reviews:
I was so appreciative of the extremely high caliber faculty/instructors that were recruited to give presentations, demos, and use of software. You all worked so well together to impart different pieces of expert knowledge. You all are brilliant and I'm inspired!!!
Loved it. We started off heavy which blew my mind but all the talks were so informative and fascinating. Really appreciate the diverse group of people you gathered together. Just wish it was in person! I would love to meet everyone.
Excellent presentation that allowed those of us with ArcMap experience to see the similarities and differences offered by ArcGis Pro. Again, a wonderful presentation (by a professional) that accounts for all the practical steps involved with data manipulation rolled into a final product.
Once I read through my notes, look at my screen captures and watch some of the presentations again, I will be able to structure my drone classes for my students. I'm developing a drone program from scratch for middle and high school students at a local charter school.
Consider signing up for the in-person training in October, and keep DroneCamp 2022 in your sights! Further information will be coming soon to the DroneCamp website, https://dronecampca.org/

The Fall 2020 UC Berkeley's Rausser College of Natural Resources Sponsored Project for Undergraduate Research (SPUR) project “Mapping municipal funding for police in California” continued in Spring 2021. This semester we continued our work with Mapping Black California (MBC), the Southern California-based collective that incorporates technology, data, geography, and place-based study to better understand and connect African American communities in California. Ben Satzman, lead in the Fall, was joined by Rezahn Abraha. Together they dug into the data, found additional datasets that helped us understand the changes in police funding from 2014 to 2019 in California and were able to dig into the variability of police spending across the state. Read more below, and here is the Spring 2021 Story Map: How Do California Cities Spend Money on Policing? Mapping the variability of police spending from 2014-2019 in 476 California Cities.
This semester we again met weekly and used data from 476 cities across California detailing municipal police funding in 2014 and 2019. By way of background, California has nearly 500 incorporated cities and most municipalities have their own police departments and create an annual budget determining what percentage their police department will receive. The variability in police spending across the state is quite surprising. In 2019 the average percentage of municipal budgets spent on policing is about 20%, and while some municipalities spent less than 5% of their budgets on policing, others allocated more than half of their budgets to their police departments. Per capita police spending is on average about $500, but varies largely from about $10 to well over $2,000.
We set out to see how police department spending changed from 2014 to 2019, especially in relation to population changes from that same 5-year interval. We used the California State Controller's Finance Data to find each city's total expenditures and police department expenditures from 2014 and 2019. This dataset also had information about each city's total population for these given years. We also used a feature class provided by CalTrans that had city boundary GIS data for all incorporated municipalities in California.
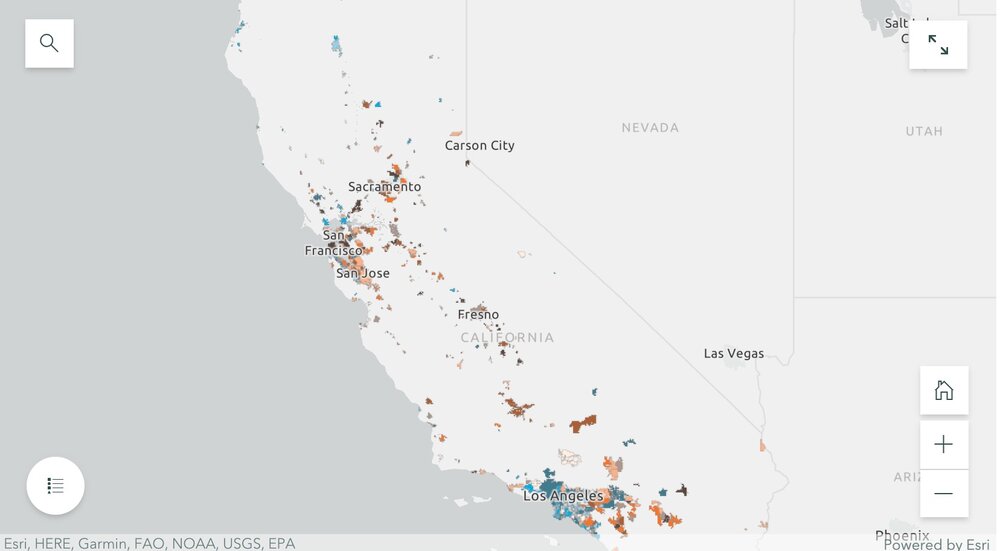
By dividing the police department expenditures by the total city expenditures for both 2014 and 2019, we were able to create a map showing what percentage of their municipal budgets 476 California cities were spending on policing. We were also able to visualize the percentage change in percentage police department spending and population from 2014 to 2019. Changes in police spending (and population change) were not at all consistent across the state. For example, cities that grew sometimes increased spending, but sometimes did not. Ben and Rezahn came up with a useful way of visualizing how police spending and population change co-vary (click on the map above to go to the site), and found 4 distinct trends in the cities examined:

-
Cities that increased police department (PD) spending, but saw almost no change in population (these are colored bright blue in the map);
-
Cities that saw increases in population, but experienced little or negative change in PD spending (these are bright orange in the map);
-
Cities that saw increases in both PD spending and population (these are dark brown in the map); and
-
Cities that saw little or negative change in both PD spending and population (these are cream in the map).
They then dug into southern California and the Bay Area, and selected mid-size cities that exemplified the four trends to tell more detailed stories. These included for the Bay Area: Vallejo (increased police department (PD) spending, but saw almost no change in population), San Ramon (increases in population, but experienced little or negative change in PD spending), San Francisco (increases in both PD spending and population) and South San Francisco (little or negative change in both PD spending and population); and for southern California: Inglewood (increased police department (PD) spending, but saw almost no change in population), Irvine (increases in population, but experienced little or negative change in PD spending), Palm Desert (increases in both PD spending and population), Simi Valley (little or negative change in both PD spending and population). Check out the full Story Map here, and read more about these individual cities.
The 5-year changes in municipal police department spending are challenging to predict. Cities with high population growth from 2014 to 2019 did not consistently increase percentage police department spending. Similarly, cities that experienced low or even negative population growths varied dramatically in percentage change police department spending. The maps of annual police department spending percentages and 5-year relationships allowed us to identify these complexities, and will be an important source of future exploration.
The analysts on the project were Rezahn Abraha, a UC Berkeley Conservation and Resource Studies Major, and Ben Satzman, a UC Berkeley Conservation and Resource Studies Major with minors in Sustainable Environmental Design and GIS. Both worked in collaboration with MBC and the Kellylab to find, clean, visualize, and analyze statewide data. Personnel involved in the project are: from Mapping Black California - Candice Mays (Partnership Lead), Paulette Brown-Hinds (Director), Stephanie Williams (Exec Editor, Content Lead), and Chuck Bibbs (Maps and Data Lead); from the Kellylab: Maggi Kelly (Professor and CE Specialist), Chippie Kislik (Graduate Student), Christine Wilkinson (Graduate Student), and Annie Taylor (Graduate Student).
We thank the Rausser College of Natural Resources who funded this effort.
Fall 2020 Story Map: Mapping Police Spending in California Cities. Examine Southern California and the Bay Area in detail, check out a few interesting cities, or search for a city and click on it to see just how much they spent on policing in 2017.
Spring 2021 Story Map: How Do California Cities Spend Money on Policing? Mapping the variability of police spending from 2014-2019 in 476 California Cities.
- Author: Andy Lyons
- Contributor: Sean Hogan
- Contributor: Nina Maggi Kelly
Like many things that start small and then go viral, the growth of DroneCamp has been welcome but challenging to sustain. The situation just got a whole lot better thanks to a grant from the UC Vice President for Research and Innovation.
DroneCamp was developed and launched in 2017 by the Informatics and GIS program in UC ANR. From the very beginning, the multi-day bootcamp style short course was designed to be highly collaborative and dynamic, with instructors coming from UC ANR, the UC Unmanned Aircraft System Safety center, and drone photogrammetry companies including Pix4D and ESRI. This was not only strategic for building long-term working relationships among campuses and the private sector, but also necessary. The expertise needed to use drones for mapping and data collection is scattered across departments and campuses, and no one unit has the resources to cover all the bases.
Over the next few years, the program grew by leaps and bounds as we went "on the road" to UC San Diego in 2018 and CSU Monterey Bay in 2019. Each year the class size, curriculum, and program complexity grew. In San Diego, the program was hosted by the UCSD Environmental Health and Safety office, with additional sessions by the UCSD Drone Lab; one of the most advanced drone labs in the UC system. DroneCamp 2019 represented a step increase in collaboration, thanks in large part to the efforts of UC ANR Vice President Glenda Humiston who connected us with Monterey Bay DART (Drones, Automation and Robotics Technology), a technology-focused economic development program based out of the nascent UC Monterey Bay Education Science & Technology Center (UCMBEST). The Institute for Innovation & Economic Development at CSU Monterey Bay, under Dean Andrew Lawson, hosted the event, opening their doors to a new academic building and an extremely modern computer lab. Flight training was held at the nearby UC NRS Fort Ord Natural Reserve, managed by UC Santa Cruz. The whole program was planned to coincide with an industry symposium implemented by DART, so that the day after the instructional sessions concluded we shifted gears to an invigorating all-day symposium on technology, policy, and regional economic development.
The scope of DroneCamp took another great leap forward in 2020, when the virtual format blew the lid off the scale and breadth of instructors, workshop topics, and participants. The talented pool of instructors in 2020 (most of whom are returning for DroneCamp 2021), hailed from across California and as far away as Ohio, including:
- UC ANR
- CSU Monterey Bay
- UC Merced
- UC Santa Cruz
- UC Davis
- UC Berkeley
- UC NRS
- Palomar College
- Open Drone Map consortium
The virtual format not only allowed the Planning Committee to expand the core instructional content covering the deep workflow of drone mapping, but we were also able to add panels in specific research applications including coastal environments and agriculture, as well as industry perspectives and technology updates. To manage the load of what was now a medium sized instructional conference, IGIS developed a custom content management system which included an automated registration dashboard to handle the many concurrent Zoom sessions. The beneficiaries of this growth included the over 330 people from 5 countries, but also the expanding network of instructors, researchers, and industry partners.
Growing however comes with costs, and although the success has been rewarding, the complexity of the program has become increasingly unwieldy for the ad hoc Planning Committee to strategically plan and coordinate. Which is why we're thrilled to share that a recent research innovation grant to UC Santa Cruz from UC Vice President for Research and Innovation Theresa Maldonado will support UCSC's growing drone program, including coordination support for DroneCamp. The new funding will allow Dr. Justin Cummings, a UAS operator and data analyst with the California Heartbeat Initiative, to spend more time coordinating the many moving parts of DroneCamp, and support the Planning Committee in continuing to deliver what has evolved over the last 5 years into one of the premiere drone mapping training events in the country.
The support and stability will also allow the Planning Committee to make inroads on some long-standing programming goals. These include developing a stronger needs assessment and evaluation framework, connecting with workforce development initiatives and continuing education programs, expanding fundraising and sponsorships, reviving the scholarship program for under-represented groups, organizing panels that bring together scientists, industry leaders, and funders, and packaging instructional materials into extension products that can be used in other settings as well as asynchronous learning.
The future of DroneCamp is bright, and 2021 should be another information packed week of drone technology and data analysis. So get your propellers on, clear some space on your hard drive, and plan to come to DroneCamp July 26-30, 2021.
DroneCamp Planning Committee:
- Sean Hogan, UC ANR IGIS Program
- Justin Cummings, UC NRS, UCSC
- Brad Barbeau, CSU Monterey Bay
- Chris Bley, InsightUp Solutions
- Becca Fenwick, UC NRS, UCSC
- Corey Garza, CSU Monterey Bay
- Pat Iampietro, CSU Monterey Bay
- Maggi Kelly, UC ANR IGIS Program
- Andy Lyons, UC ANR IGIS Program
- Michael Matkin, UC Santa Cruz
- Josh Metz, DART
- Mallika Nocco, UC ANR
- Brandon Stark, UC Merced
- Author: Andy Lyons
For the past several years, IGIS has been offering online Office Hours for the ANR community on a range of topics related to geospatial science and technology. In 2020, we increased our Office Hours appointments to 4 hours a week. Today the IGIS team is pleased to announce the addition of three new topic areas to our lineup of support for 2021:
Google Earth Engine (January-May 2021 only). Earth Engine is an online platform from Google that provides access to a vast array of imagery and a powerful scripting language for analysis and visualization. Annie Taylor, who taught two extremely popular Earth Engine workshops in 2020, is an Earth Engine whiz and will help you get over any Earth Engine bumps you may be facing.
Cal-Adapt. Cal-Adapt provides access to climate data and visualization tools from California's 4th Climate Change assessment. We work closely with the Cal-Adapt team on a couple of projects and love to talk about climate data. Need to work with Cal-Adapt data in a programming environment? IGIS's Shane Feirer and Andy Lyons have developed add-ons to work with Cal-Adapt data in Python, ArcGIS Pro, and R.
Advanced Google Sheets and Google Apps Script. Underlying Google Sheets, Forms, Docs, and other GSuite apps is a powerful scripting language called Apps Script. We use these tools a lot (in fact the sign-up system for Office Hours is driven by Apps Script), so if you want to do something out-of-the-box with Google Sheets, automate your work, or develop integrated workflows across applications, we might be able to help.
These new topics are in addition to our usual portfolio of support subjects, including:
GIS - desktop software, web GIS, mobile data collection, automation
drones - safety and regulations, equipment, mission planning, data processing and analysis, Pix4D, data management
spatial data and analysis - going from questions to workflows, finding data, spatial analysis
R - programming, working with spatial data in R, statistical analysis, Shiny apps
remote sensing - finding data, image processing and analysis, ENVI
databases - designing data structures, MS Access, SQL
We love Office Hours because it gives us a chance to meet new people, share what we know, and keep us sharp. So please don't be shy when you have a question or don't know where to start - sign up for Office Hours!

