
- Author: Sean D Hogan
- Author: Steven Worker
IGIS is proud to announce its collaboration with 4H on a new and exciting, three-year, USDA-funded grant, Ag from Above x Ag for All (AFA2), aimed at sparking interest in food and agriculture among teenagers by using cutting-edge drone and mapping technologies. By blending hands-on activities with real-world applications, AFA2 empowers young people to explore the science behind agriculture in fun and meaningful ways. AFA2 is not just about teaching technology—it's about using that technology to make a real difference in communities and ensuring that the next generation of agricultural scientists and leaders is diverse, skilled, and ready to take on the challenges of the future.
Period: 3-years from August 1, 2024 to July 31, 2027.
Tasks: Develop, test, and evaluate two curricula, SkyMappers: Agricultural Drones and GIS Mastery, Dronovation: Cultivating Change with Teens, and prepare an educator professional development guide.
Who It's For: This project targets teenagers aged 13 to 18, with special attention to including girls and Latino youth—groups often underrepresented in STEM fields.
Why It Matters: The future of farming and food production will increasingly rely on technology. By engaging young people with drones and GIS, AFA2 aims to build their scientific literacy and interest in agriculture, while also preparing them for future careers in these vital fields. Additionally, by focusing on food justice and culturally relevant learning, we aim to empower all young people to see themselves as future leaders in science and agriculture.
Our Partners: University of California's Cooperative Extension, 4-H Youth Development Program, Informatics and GIS Program, the UC Santa Cruz CITRIS Initiative for Drone Education and Research, and the UC Davis AI Institute for Next Generation Food Systems.
- PI: Steven Worker, 4-H Youth Development Advisor (Sonoma)
- Co-PI: Nathaniel Caeton, 4-H Youth Development Advisor (Shasta)
- Co-PI: Matthew Rodriguez, 4-H Youth Development Advisor (Placer)
- Co-PI: Andy Lyons, IGIS Program Coordinator (UC Berkeley)
- Co-PI: Sean Hogan, IGIS Academic Coordinator (Davis)
- Collaborator: Flavie Audoin, Rangeland Management Extension Specialist (Univ. of Arizona)
- Collaborator: Lucy Diekmann, Urban Agriculture/Food System Advisor (Santa Clara)
- Collaborator: Becca Fenwick, Director, CITRIS Initiative for Drone Education and Research (UCSC)


- Author: Genoa Starrs
R and Python together at last, the AI takeover, and Quarto ups its game.
Posit::Conf, Posit's annual conference, was held last week in Seattle, WA. While the name might be unfamiliar, many of you might recognize Posit's previous iteration, RStudio. Posit has produced many products R users know and love, including RStudio, Shiny and the Tidyverse. After a whirlwind three days, here are some takeaways from the conference!
A New All-in-One IDE
Togetherness was a key theme, with Posit rolling out the beta version of Positron, an IDE that combines elements of RStudio, VS Code, and introduces its own unique features. While switching IDEs is generally not at the top of any coder's to-do list, Positron is multilingual, enabling users to code in R, Python, and Julia within a single project. It also introduces new ways to interact with your data, such as readily available summary statistics, the ability to filter or sort data by multiple fields while retaining the active query in the window at all times, and the option to resize graphs and figures in the plots pane through a simple user interface. Positron also leverages many new and existing VS Code extensions, offering a wealth of customization and additional capabilities. Rstudio is by no means leaving the picture– Positron is still in beta, and Rstudio will continue to be supported for a good, long time. However, if you (like me) crave a unified interface for your R and Python coding, Positron may be worth trying out.
Helping R Users Learn Python
For Py-curious R coders, a session on “Python Rgonomics” suggested some packages to make the transition easier for those of us spoiled by the tidyverse.
-
Polars for exceptionally fast data wrangling and dplyr-like syntax
-
Plotnine and seaborn for ggplot-like syntax when making graphs and figures
-
Great tables for producing functional, readable tables (also available in R as the gt package).
-
Pyenv for environment management.
-
Pins (for R and Python!) publishes objects to “boards” that allows users (or multiple users) to access them across projects. Boards can include shared/networked folders, like DropBox or Google Drive.
AI for All
Melissa Van Bussel provided practical tips for using generative AI. She highlighted some new capabilities of ChatGPT 4o, including the ability to transcribe handwritten notes and tables, preserving colors and formatting. GPT can even convert these into HTML or Quarto formats.
She shared insights on prompt engineering (i.e., how you ask questions to AI engines), noting, “Writing effective prompts goes hand in hand with your existing expertise.” Achieving correct and effective output requires providing specific prompts and making corrections when errors occur. She recommended structuring prompts in a way that mirrors coding practices. For example, to generate a graph, start by specifying the data, then define how to map each axis and assign colors. Next, specify the graph or chart type and indicate any grouping by other variables. Finish with aesthetic (eg palette, theme, title, legend) preferences.
While presenters were enthusiastic about the possibilities of generative AI, a recurring theme was the necessity for users to provide clear direction and verify the results. One presenter compared AI to hiring a new human assistant—AI can assist with tasks effectively when given proper guidance but will make mistakes and requires careful supervision. Generative AI performs best when used to quickly accomplish tasks that users already have the knowledge and skills to handle themselves.
One of the most prevalent use cases for generative AI was in combination with Shiny. Joe Cheng's presentation demonstrated integrating AI into Shiny apps, specifically into Shiny dashboards. Users could request modifications to the data displayed on the dashboard using plain language, which the AI translated into SQL queries to adjust the output based on the request. This is particularly noteworthy as the AI accessed only the schema, not the actual data, to apply the filters.
Winston Chang developed an AI assistant to help people build Shiny apps and did a live demonstration. Although still experimental, Shiny for R is widely used, and the assistant showed promising outputs.
Quarto Expands its Horizons
Quarto is a relatively new version of R Markdown (a publishing tool) that allows users to knit together code into documents, dashboards, web pages, PDFs, and even eBooks. An added advantage of Quarto is its multilingual capability– it, like Positron, supports both R and Python. Some new capabilities were highlighted at the conference:
-
Dashboards: Easily build dashboards using the Quarto extension in RStudio or Positron. Each visualization (graphs, maps, tables, and even just text boxes) can be arranged like tiles or cards. Dashboards can also include sidebars and toolbars, and can support interactivity, including cards that use jupyter widgets, leaflet, and shiny.
-
PDFs: Quarto now uses typst instead of LaTeX, enabling users to create customized PDF outputs with a more intuitive language.
-
HTML (Websites): Quarto (like R Markdown) can produce HTML outputs. However, now it also supports more flexible HTML code chunks, and allows for HTML/CSS/JavaScript integration.
-
Quarto live: A quarto extension that allows users to embed code blocks and exercises for R and Python into Quarto documents. This has lots of teaching applications, and can be used to generate exercises similar to those you find in DataCamp and other online coding courses.
-
Closeread: A scrollytelling extension for quarto that enables interactive storytelling similar to that seen in fancy New York Times articles or Esri Storymaps. The gallery has some example outputs, while the guide can walk you through the process of creating your own scrollytelling page.
Finally, one of my favorite quality-of-life take homes was simply that it is possible to include emoji in your R or Python code, either using unicode or simply pasting them in. While the demonstrated use case was to make specific messages stand out in your log or printed statements, sometimes a picture can convey what 1000 characters cannot and help you enjoy coding just a little bit more.
If you love (or begrudgingly engage in) data science, I encourage you to check it out next year– virtual registration for educators and academics in 2024 was free, and hopefully will be next year too!

- Author: Shane T Feirer
The third day of the ESRI User Conference was an exhilarating deep dive into the world of Artificial Intelligence. The AI Summit, the first of its kind hosted by ESRI, focused on the integration of AI into the ESRI ArcGIS Suite of software and tools. The excitement in the air was palpable as attendees explored the transformative potential of AI in GIS.
AI Summit Highlights
The AI Summit highlighted the strategic incorporation of AI into two broad categories within the ArcGIS ecosystem: GeoAI and AI Assistants.
- GeoAI: This category encompasses advanced AI models and algorithms specifically designed forgeospatial analysis. Attendees learned about howGeoAI can enhance spatial data interpretation, improve predictive modeling, and support more accurate decision-making. The sessions showcased real-world applications, demonstrating howGeoAI is being used to tackle complex challenges. These tools included:
- Deep Learning Models and object detection and pixel classification
- Unstructured text searching and geocoding
- and many others
- AI Assistants: These tools are designed to augment the user experience within theArcGIS platform, making it more intuitive and efficient. AI Assistants leverage generative AI to provide intelligent recommendations, automate routine tasks, and enhance data visualization. The demonstrations highlighted how these assistants can streamlineworkflows, improve productivity, and empower users to extract deeper insights from their data. AI assistants are being included in:
- Help documentation, online and within ArcGIS Pro
- Webmapping - Smart mapping
- Survey 123 webform design
- ArcGIS AI Hub Assistant
- and the list goes on
Innovative Applications and Future Directions
Throughout the day, experts and innovators shared their experiences and insights on the cutting-edge applications of AI in GIS. From machine learning models that classify historic and current aerial photos to AI-driven tools that optimize road condition extraction from full motion video capture, the presentations underscored the vast potential of AI to revolutionize the field.
Exciting Outcomes
One significant outcome of the day was my decision to request access to ArcGIS Hub Premium and its AI Assistant. This powerful tool will enable the querying of geospatial data created and maintained by IGIS and UCANR using AI using a natural language model. This will open up major opportunities for those needing information about UCANR and data that is important to Californians, making it easier to access, analyze, and leverage critical geospatial information.
Looking Ahead
The integration of AI into the ArcGIS Suite represents a significant leap forward, promising to unlock new possibilities for geospatial analysis and decision-making. As the conference progresses, attendees are eager to see how these advancements will continue to evolve and shape the future of GIS.
Perspective on AI
In response to concerns that AI might replace GIS professionals, the panelists provided some important perspectives. They emphasized that GIS professionals may potentially lose their jobs if they don't embrace AI. Just like if a GIS Professional was still using AML or Avenue programming laguages instead of modern languages and tools, they would eventually be replaced by someone who was using new languages and tools. The was reinforced a comment by one panelist who added, "If you lose your job because of AI, it will be to someone who is using AI."
Stay tuned for more updates and insights from the 2024 ESRI User Conference! The journey into the future of GIS, powered by AI, has just begun.

- Author: Shane T Feirer
The first day of the 2024 ESRI User Conference was filled with exciting announcements and innovative stories of Conservation and GIS. With around 21,000 attendees in San Diego and an additional people joining virtually, the energy and enthusiasm were palpable.
Plenary
Jack Dangermond and the ESRI team highlighted several new offerings in their plenary session. Notably, they introduced new datasets in the ArcGIS Living Atlas, including a national tile service of parcel boundaries and a feature layer of iNaturalist species observation data. These additions promise to provide users with even more comprehensive and valuable data for their projects.
The Governor of Minnesota, Tim Walz, a former high school Geography teacher, delivered an impassioned plenary speech on the importance of GIS in solving the challenges we face today. He emphasized the critical need for maps, data, and the work that GIS professionals do to address global issues.
New Apps and Features
ESRI also showcased a range of new apps in ArcGIS Online:
- Portfolio App: Designed to help users highlight key maps of interest, making it easier to share important insights with others.
- Web Editor App: This app offers a web-based editing experience similar to editing in ArcGIS Pro, making it more accessible for users to update and manage their data.
- Generative AI in AI Assistants: The inclusion of generative AI enhances the capabilities of spatial analysis, providing users with more intelligent and responsive tools and apps.
Additionally, several new story map templates were introduced, adding more options for users to create compelling narratives with their data.
Looking Ahead
With so many exciting developments on the first day, attendees can look forward to even more innovations and detailed sessions over the next three days. The future of GIS is looking bright, and the tools and features unveiled at this conference are set to drive the industry forward.
Stay tuned for more updates and insights from the 2024 ESRI User Conference in the coming days!
- Author: Andrew J Lyons
- Contact: Sean D Hogan

June 24-28, 2024
CSU Monterey Bay
(plus virtual open)
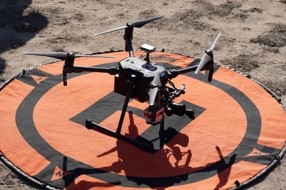
DroneCamp is a premiere five-day training program that covers everything you need to know to use drones for mapping and data collection.
Curriculum at a Glance
- equipment
- safety & regulations
- flight planning
- manual & autonomous flight
- photogrammetry
- hands-on data processing with Pix4D, OpenDroneMap & ArcGIS Pro
- data analysis & visualization
- research talks & use cases
- educator track - new for 2024!
Now in its eighth year, Drone Camp 2024 will once again provide a unique drone training opportunity designed for a wide range of skill levels and interests, from complete beginners with little to no experience in drone technology, to intermediate users who want to learn more advanced data processing and analysis.
DroneCamp started out as an IGIS workshop, but has evolved into a highly collaborative program with instructors coming from 8 campuses including UC ANR, UC Merced, UC Santa Cruz, CSU Monterey Bay, UC Davis, UC Berkeley, UC Santa Barbara, Lakeland College, and American River College.
DroneCamp 2024 will be held in-person at CSU Monterey Bay June 24-28, 2024. Scholarships to cover the registration fee are available for all ANR academics and staff - but you must apply soon! More info available at DroneCampCA.org.
 |
 |
 |
 |

