
I left Boulder 20 years ago on a wing and a prayer with a PhD in hand, overwhelmed with bittersweet emotions. I was sad to leave such a beautiful city, nervous about what was to come, but excited to start something new in North Carolina. My future was uncertain, and as I took off from DIA that final time I basically had Tom Petty's Free Fallin' and Learning to Fly on repeat on my walkman. Now I am back, and summer in Boulder is just as breathtaking as I remember it: clear blue skies, the stunning flatirons making a play at outshining the snow-dusted Rockies behind them, and crisp fragrant mountain breezes acting as my Madeleine. I'm back to visit the National Ecological Observatory Network (NEON) headquarters and attend their 2017 Data Institute, and re-invest in my skillset for open reproducible workflows in remote sensing.
Day 1 Wrap Up from the NEON Data Institute 2017
What a day! http://neondataskills.org/data-institute-17/day1/
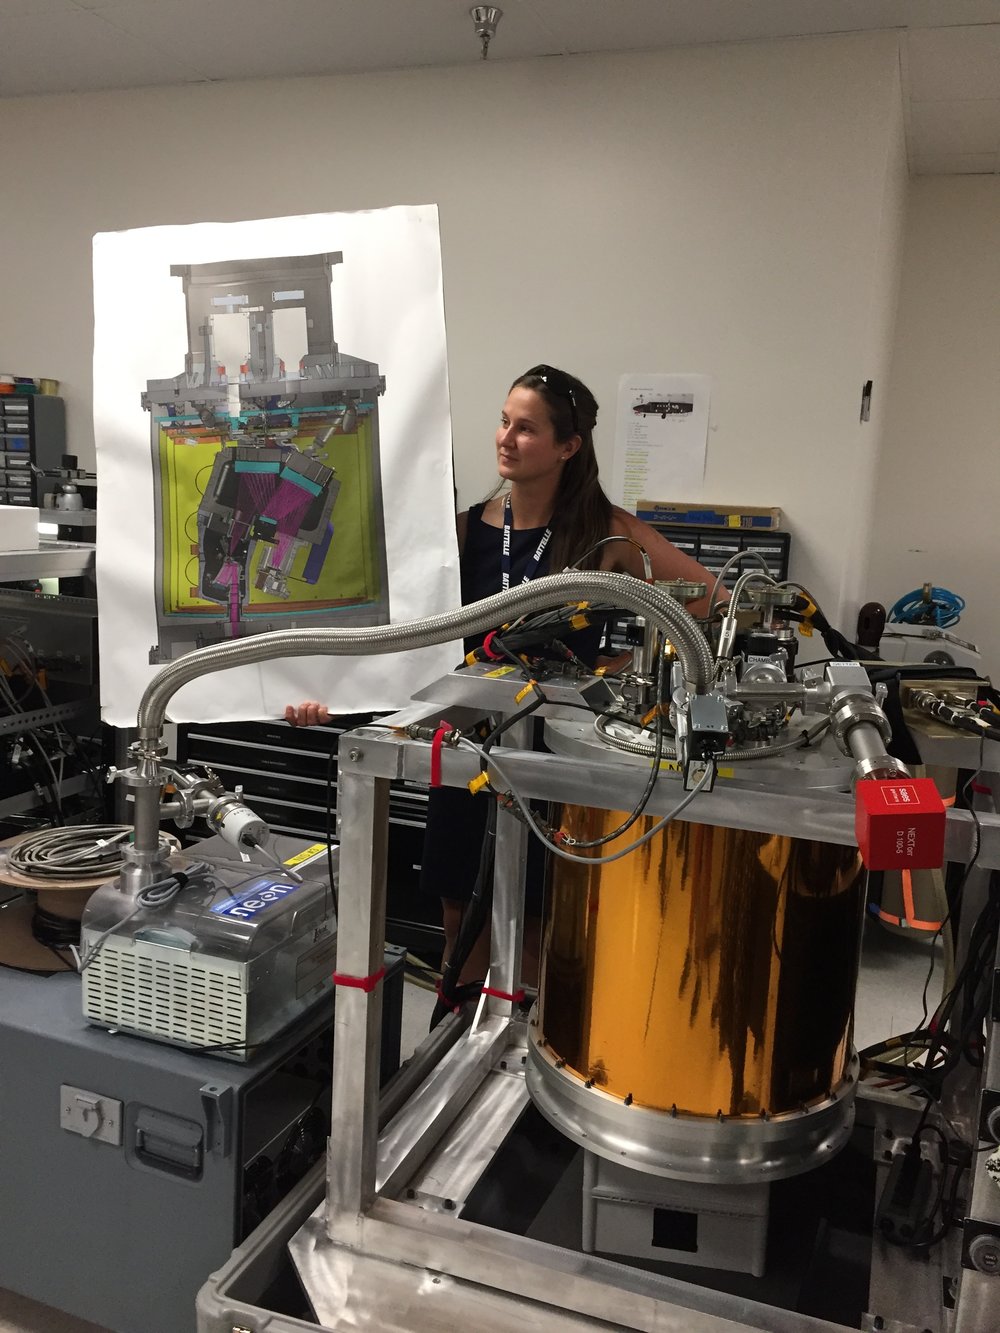
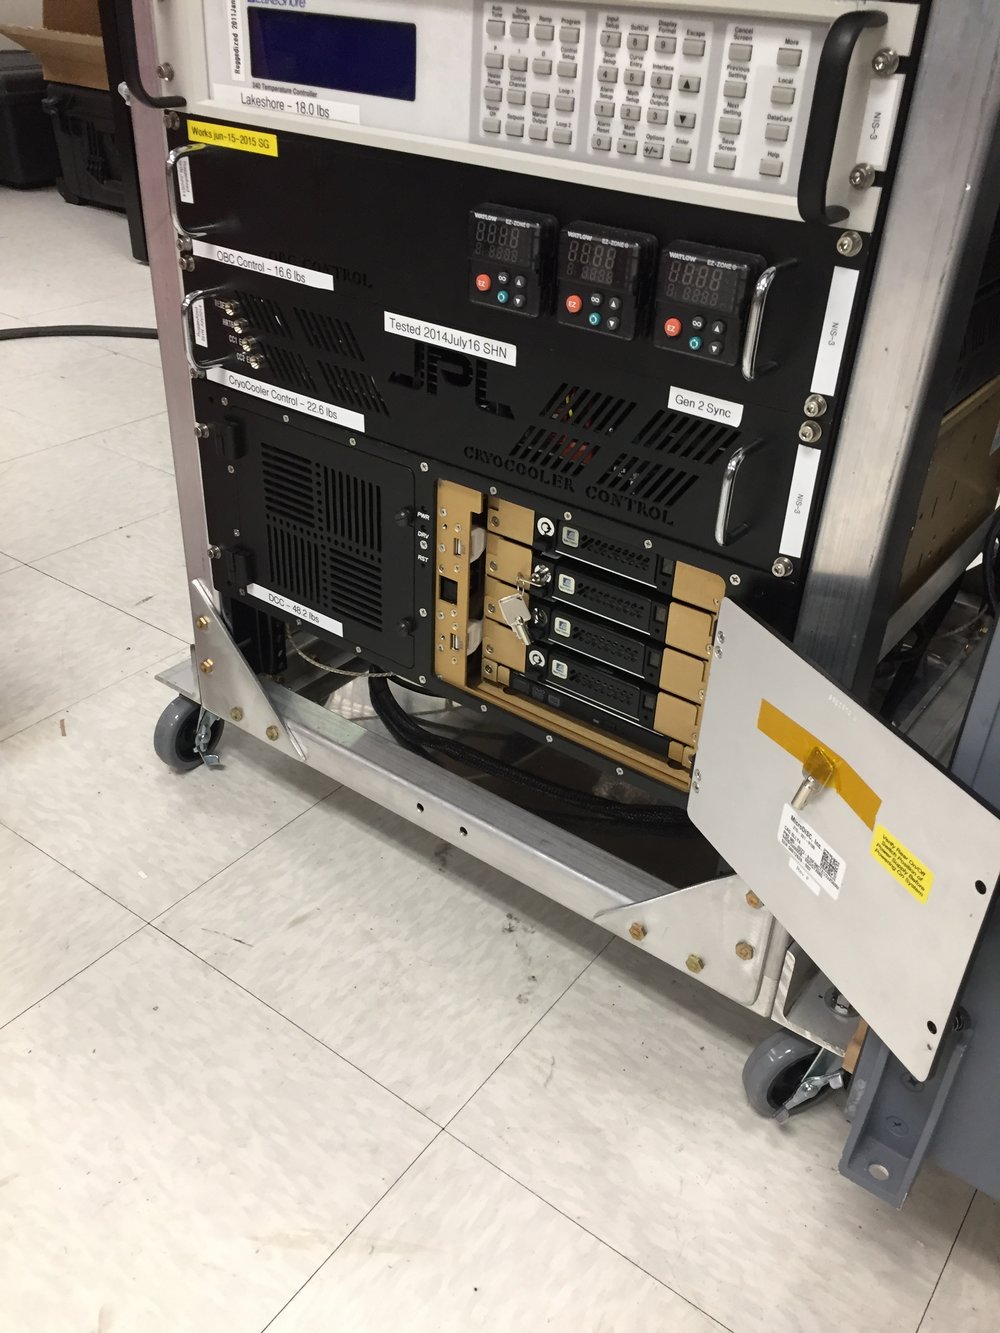
Attendees (about 30) included graduate students, old dogs (new tricks!) like me, and research scientists interested in developing reproducible workflows into their work. We are a mix of ages and genders. The morning session focused on learning about the NEON program (http://www.neonscience.org/): its purpose, sites, sensors, data, and protocols. NEON, funded by NSF and managed by Battelle, was conceived in 2004 and will go online for a 30-year mission providing free and open data on the drivers of and responses to ecological change starting in Jan 2018. NEON data comes from IS (instrumented systems), OS (observation systems), and RS (remote sensing). We focused on the Airborne Observation Platform (AOP) which uses 2, soon to be 3 aircraft, each with a payload of a hyperspectral sensor (from JPL, 426, 5nm bands (380-2510 nm), 1 mRad IFOV, 1 m res at 1000m AGL) and lidar (Optech and soon to be Riegl, discrete and waveform) sensors and a RGB camera (PhaseOne D8900). These sensors produce co-registered raw data, are processed at NEON headquarters into various levels of data products. Flights are planned to cover each NEON site once, timed to capture 90% or higher peak greenness, which is pretty complicated when distance and weather are taken into account. Pilots and techs are on the road and in the air from March through October collecting these data. Data is processed at headquarters.
In the afternoon session, we got through a fairly immersive dunk into Jupyter notebooks for exploring hyperspectral imagery in HDF5 format. We did exploration, band stacking, widgets, and vegetation indices. We closed with a fast discussion about TGF (The Git Flow): the way to store, share, control versions of your data and code to ensure reproducibility. We forked, cloned, committed, pushed, and pulled. Not much more to write about, but the whole day was awesome!
Fun additional take-home messages:
- NEON is amazing. I should build some class labs around NEON data, and NEON classroom training materials are available: http://www.neonscience.org/resources/data-tutorials
- Making participants do organized homework is necessary for complicated workshop content: http://neondataskills.org/workshop-event/NEON-Data-Insitute-2017
- HDF5 as an possible alternative data format for Lidar - holding both discrete and waveform
- NEON imagery data is FEDExed daily to headquarters after collected
- I am a crap python coder
- #whofallsbehindstaysbehind
- Tabs are my friend
Thanks to everyone today, including: Megan Jones (Main leader), Nathan Leisso (AOP), Bill Gallery (RGB camera), Ted Haberman (HDF5 format), David Hulslander (AOP), Claire Lunch (Data), Cove Sturtevant (Towers), Tristan Goulden (Hyperspectral), Bridget Hass (HDF5), Paul Gader, Naupaka Zimmerman (GitHub flow).


Today we had our 1st Data Science for the 21st Century Program Conference. Some cool things that I learned:
- Cathryn Carson updated us on the status of the Data Science program on campus - we are teaching 1200 freshman data science right now. Amazing. And a new Dean is coming.
- Phil Stark on the danger of being at the bleeding edge of computation - if you put all your computational power into your model, you have nothing left to evaluate uncertainty in your model. Let science guide data science.
- David Ackerly believes in social networking!
- Cheryl Schwab gave us an summary of her evaluation work. The program outcomes that we are looking for in the program are: Concepts, communication, interdisciplinary research
- Trevor Houser from the Rhodian Group http://rhg.com/people/trevor-houser gave a very interesting and slightly optimistic view of climate change.
- Break out groups, led by faculty:
- (Boettiger) Data Science Grand Challenges: inference vs prediction; dealing with assumptions; quantifying uncertainty; reproducibility, communication, and collaboration; keeping science in data science; and keeping scientists in data science.
- (Hsiang) Civilization collapses through history:
- (Ackerly) Discussion on climate change and land use. 50% of the earth are either crops or rangelands; and there is a fundamental tradeoff between land for food and wildlands. How do we deal with the externalities of our love of open space (e.g. forcing housing into the central valley).
- Finally, we wrapped up with presentations from our wonderful 1st cohort of DS421 students and their mini-graduation ceremony.
- Plus WHAT A GREAT DAY! Berkeley was splendid today in the sun.

They say:
Are you a college student, researcher or professor? We’re looking for innovative academics, researchers and scientists to unlock the power of a one-of-a-kind dataset. You can now apply for access to Planet’s unique dataset for non-commercial research purposes. In an area as large as 2,000 square kilometers, you’ll have access to download imagery, analyze trends, and publish your results.
Check it: https://www.planet.com/products/education-and-research/

Day 3: I opened the day with a lovely swim with Elizabeth Havice (in the largest pool in New England? Boston? The Sheraton?) and then embarked on a multi-mile walk around the fair city of Boston. The sun was out and the wind was up, showing the historical buildings and waterfront to great advantage. The 10-year old Institute of Contemporary Art was showing in a constrained space, but it did host an incredibly moving video installation from Steve McQueen (Director of 12 Years a Slave) called “Ashes” about the life and death of a young fisherman in Grenada.
My final AAG attendance involved two plenaries hosted by the Remote Sensing Specialty Group and the GIS Specialty Group, who in their wisdom, decided to host plenaries by two absolute legends in our field – Art Getis and John Jensen – at the same time. #battleofthetitans. #gisvsremotesensing. So, I tried to get what I could from both talks. I started with the Waldo Tobler Lecture given by Art Getis: The Big Data Trap: GIS and Spatial Analysis. Compelling title! His perspective as a spatial statistician on the big data phenomena is a useful one. He talks about how data are growing fast: Every minute – 98K tweets; 700K FB updates; 700K Google searches; 168+M emails sent; 1,820 TB of data created. Big data is growing in spatial work; new analytical tools are being developed, data sets are generated, and repositories are growing and becoming more numerous. But, there is a trap. And here is it. The trap of Big Data:
10 Erroneous assumptions to be wary of:
- More data are better
- Correlation = causation
- Gotta get on the bandwagon
- I have an impeccable source
- I have really good software
- I am good a creating clever illustrations
- I have taken requisite spatial data analysis courses
- It’s the scientific future
- Accessibly makes it ethical
- There is no need to sample
He then asked: what is the role of spatial scientists in the big data revolution? He says our role is to find relationships in a spatial setting; to develop technologies or methods; to create models and use simulation experiments; to develop hypotheses; to develop visualizations and to connect theory to process.
The summary from his talk is this: Start with a question; Differentiate excitement from usefulness; Appropriate scale is mandatory; and Remember more may or may not be better.
When Dr Getis finished I made a quick run down the hall to hear the end of the living legend John Jensen’s talk on drones. This man literally wrote the book on remote sensing, and he is the consummate teacher – always eager to teach and extend his excitement to a crowded room of learners. His talk was entitled Personal and Commercial Unmanned Aerial Systems (UAS) Remote Sensing and their Significance for Geographic Research. He presented a practicum about UAV hardware, software, cameras, applications, and regulations. His excitement about the subject was obvious, and at parts of his talk he did a call and response with the crowd. I came in as he was beginning his discussion on cameras, and he also discussed practical experience with flight planning, data capture, and highlighted the importance of obstacle avoidance and videography in the future. Interestingly, he has added movement to his “elements of image interpretation”. Neat. He says drones are going to be routinely part of everyday geographic field research.
What a great conference, and I feel honored to have been part of it.

Between the years 1949-1979 the Pacific Southwest research station branch of the U.S. Forest service published two series of maps: 1) The Soil-Vegetation Maps, and 2) Timber Stand Vegetation Maps. These maps to our knowledge have not been digitized, and exist in paper form in university library collections, including the UC Berkeley Koshland BioScience Library.
Index map for the Soil Vegetation MapsThe Soil-Vegetation Maps use blue or black symbols to show the species composition of woody vegetation, series and phases of soil types, and the site-quality class of timber. A separate legend entitled “Legends and Supplemental Information to Accompany Soil-Vegetation Maps of California” allow for the interpretation of these symbols in maps published 1963 or earlier. Maps released following 1963 are usually accompanied by a report including legends, or a set of “Tables”. These maps are published on USGS quadrangles at two scales 1:31,680 and 1:24,000. Each 1:24,000 sheet represents about 36,000 acres.
The Timber Stand Vegetation Maps use blue or black symbols to show broad vegetation types and the density of woody vegetation, age-size, structure, and density of conifer timber stands and other information about the land and vegetation resources is captured. The accompanying “Legends and Supplemental Information to Accompany Timber Stand-Vegetation Cover Maps of California” allows for interpretation of those symbols. Unlike the Soil-Vegetation Maps a single issue of the legend is sufficient for interpretation.
We found 22 quad sheets for Sonoma County in the Koshland BioScience Library at UC Berkeley, and embarked upon a test digitization project.
Scanning. Using a large format scanner at UC Berkeley’s Earth Science and Map library we scanned each original quad at a standard 300dpi resolution. The staff at the Earth Science Library completes the scans and provides an online portal with which to download.
Georeferencing. Georeferencing of the maps was done in ArcGIS Desktop using the georeferencing toolbar. For the Sonoma county quads which are at a standard 1:24,000 scale we were able to employ the use of the USGS 24k quad index file for corner reference points to manually georeference each quad.
Error estimation. The georeferencing process of historical datasets produces error. We capture the error created through this process through the root mean squared error (RMSE). The min value from these 22 quads is 4.9, the max value is 15.6 and the mean is 9.9. This information must be captured before the image is registered. See Table 1 below for individual RMSE scores for all 22 quads.
Conclusions. Super fun exercise, and we look forward to hearing about how these maps are used. Personally, I love working with old maps, and bringing them into modern data analysis. Just checking out the old and the new can show change, as in this snap from what is now Lake Sonoma, but was the Sonoma River in the 1930s.

Thanks Kelly and Shane for your work on this!

