- Author: Shane T Feirer
The third day of the ESRI User Conference was an exhilarating deep dive into the world of Artificial Intelligence. The AI Summit, the first of its kind hosted by ESRI, focused on the integration of AI into the ESRI ArcGIS Suite of software and tools. The excitement in the air was palpable as attendees explored the transformative potential of AI in GIS.
AI Summit Highlights
The AI Summit highlighted the strategic incorporation of AI into two broad categories within the ArcGIS ecosystem: GeoAI and AI Assistants.
- GeoAI: This category encompasses advanced AI models and algorithms specifically designed forgeospatial analysis. Attendees learned about howGeoAI can enhance spatial data interpretation, improve predictive modeling, and support more accurate decision-making. The sessions showcased real-world applications, demonstrating howGeoAI is being used to tackle complex challenges. These tools included:
- Deep Learning Models and object detection and pixel classification
- Unstructured text searching and geocoding
- and many others
- AI Assistants: These tools are designed to augment the user experience within theArcGIS platform, making it more intuitive and efficient. AI Assistants leverage generative AI to provide intelligent recommendations, automate routine tasks, and enhance data visualization. The demonstrations highlighted how these assistants can streamlineworkflows, improve productivity, and empower users to extract deeper insights from their data. AI assistants are being included in:
- Help documentation, online and within ArcGIS Pro
- Webmapping - Smart mapping
- Survey 123 webform design
- ArcGIS AI Hub Assistant
- and the list goes on
Innovative Applications and Future Directions
Throughout the day, experts and innovators shared their experiences and insights on the cutting-edge applications of AI in GIS. From machine learning models that classify historic and current aerial photos to AI-driven tools that optimize road condition extraction from full motion video capture, the presentations underscored the vast potential of AI to revolutionize the field.
Exciting Outcomes
One significant outcome of the day was my decision to request access to ArcGIS Hub Premium and its AI Assistant. This powerful tool will enable the querying of geospatial data created and maintained by IGIS and UCANR using AI using a natural language model. This will open up major opportunities for those needing information about UCANR and data that is important to Californians, making it easier to access, analyze, and leverage critical geospatial information.
Looking Ahead
The integration of AI into the ArcGIS Suite represents a significant leap forward, promising to unlock new possibilities for geospatial analysis and decision-making. As the conference progresses, attendees are eager to see how these advancements will continue to evolve and shape the future of GIS.
Perspective on AI
In response to concerns that AI might replace GIS professionals, the panelists provided some important perspectives. They emphasized that GIS professionals may potentially lose their jobs if they don't embrace AI. Just like if a GIS Professional was still using AML or Avenue programming laguages instead of modern languages and tools, they would eventually be replaced by someone who was using new languages and tools. The was reinforced a comment by one panelist who added, "If you lose your job because of AI, it will be to someone who is using AI."
Stay tuned for more updates and insights from the 2024 ESRI User Conference! The journey into the future of GIS, powered by AI, has just begun.
- Author: Sean Hogan
The thing that I possibly like the most about the ESRI Users Conference is that you not only get to see all of the recent updates that the company has recently developed but also glimpses of what is coming soon. In particular, I am excited about the advancements that they have made in respect to web mapping applications.
Are you an ArcGIS Online user, and have been wondering when to transition from the Traditional Web Map Viewer to the new Web Map Viewer? To answer that question, for myself, I think the time is now. At this point, per ESRI, there are now only four remaining functionalities that remain to be added to the new Map Viewer to give it all of the functionality that the Traditional Map Viewer had, which will be discontinued in late 2025, including the abilities to:
- Calculate fields (this would be nice to have)
- Add additional relationships to related records (something I have never needed to do previously)
- Vector tile style editing (not something I have ever needed to do, but which I could see being useful for some people)
- Saving/duplicating layers (there is a relatively simple work around for this, but it would be nice to have it built into the Map Viewer)
That said, there are far more than four added functionalities that the new Map Viewer has that the old version lacks, including:
- Easier browsing of data
- Feature editing enhancements
- Analysis enhancements, both for vectors and rasters
- Shortcuts
- Improved visibility, filtering, and effects (on the fly)
- Toggleable layers
- Charts (donut and pie)
- Label enhancements (including improved bookmarks and placements)
- Blending (in a group layer); including blending layers with basemaps and multiply effects
- Added display expressions
- Multidimensional imagery support, including an imagery slider
- The ability to upload feature symbols (svg)
- Sketch layers (as opposed to Classic's notes) with snapping, and also with the ability to upload custom symbols
- The ability to add and manually georeferenced media layers (jpg or png) using control points (on which media blending and effects can also be applied)
Besides all of these additions, the interface has been thoughtfully revamped with usability and efficiency in mind. Some of the above enhancements will now allow you to complete some work flows/functions several times faster than they could be done before. I must admit that I am very pleased!
- Author: Shane Feirer

This is the 42nd ESRI User Conference yet in some ways it felt like the first. This is the first in-person user conference since the COVID—19 outbreak after almost 2 and a half years. All in-person participants had to have proof of vaccination to attend, even with that requirement there are over 14,000 participants. I heard more than once that it was nice to be meeting again in person.
The tag line from ESRI this year is ‘GIS – Mapping Common Ground'. They are making the case that GIS will help us as a society meet/share data on Common Ground. This can be when addressing complex issues such as Climate Change, Conservation Planning, Urban Planning etc. All these activities need us all to meet on common ground and mapping helps with that. We heard about the development and use of Geospatial data from Deanne Criswell the Director of FEMA and California's Natural Resources Secretary - Wade Crowfoot Crowfoot and Nate Roth from the Department of Conservation's Chief Science and Data Advisor, they described the data and the tools created for the California 30x30 initiative these data will be available in a web app developed in concert with ESRI https://www.californianature.ca.gov/.
I the coming days I am looking forward to hearing about the new tools that ESRI have been developing. These tools include ArcGIS Insights, Spatial Analysis of Big Data, Knowledge Graphs, etc, I look forward to writing more about the advancements as the week progresses.
- Author: Shane Feirer
Normally at this time of Year, I am getting ready to travel to San Diego for the ESRI User Conference. At the user conference 20,000 people from all over the world gather to hear about what new GIS tools and functionality ESRI is building into their GIS products. The participants also attend hundreds of technical sessions and workshops to improve their GIS Skills and they also network and discuss how they are using GIS in their fields of interests.
This year with COVID-19 the in-person user conference is not occurring, and the User Conference is going to be presented as a virtual conference (see agenda) with plenary sessions, technical sessions, and technical support. This is unfortunate, but it provides for a broader community to attend the plenary and learn about how GIS is currently being used and what GIS can be used for.
The plenary session is always an eye-opener! It typically has examples of impactful ways in which GIS is changing the world - examples from education, environment, planning, health, and so much more! It is really a great experience, and I recommend it.
If you are curious about what GIS can do or to get ideas about how else GIS could be used in our Organization please register and attend the plenary sessions of the ESRI Virtual User Conference. If you want to talk about GIS or about what you saw at the Virtual User Conference, please email me at igis@ucanr.edu.
https://www.esri.com/en-us/about/events/uc/overview
From ESRI:
‘Get access to the Plenary Session livestream
Watch powerful stories about how GIS is making a difference in the world. See demonstrations of Esri technology and learn about the newest upgrades. Hear a keynote from Jack Dangermond and presentations from other thought-provoking speakers.
Plenary Session access is complimentary for everyone'
Registration Now for the Plenary:
https://www.esri.com/en-us/lg/events/20/virtual-uc-plenary-livestream-sign-up
- Author: Shane Feirer
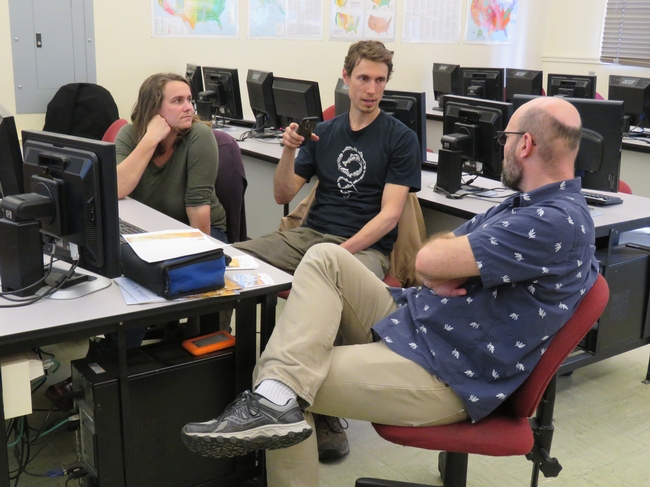
IGIS worked with UCANR Advisors Mike Jones, Rick Satomi, and Yana Valachovic to conduct two 2-day training workshops in Northern California the week of March 18th-23rd. These workshops were held in Santa Rosa, CA and Arcata, CA. and they were well attended by approximately 20 participants at each location. The intent of these workshops were to bring the participants up to speed on the latest GIS software (ArcGIS Pro, and ArcGIS Online), best practices in cartography, managing data, and spatial analysis, and mobile data collection (ArcGIS Collector, ArcGIS Survey 123, and Azenva).
IGIS will conduct these workshops two more times in the coming months. These workshops will be held at the following locations and dates:
- Lake Tahoe Community College, April 25 – 26
- Shasta College, May 10 – 11
For More Information: Please see the following website: http://ceshasta.ucanr.edu/Forestry/ForestGIS/
Register now at: UCANR.EDU/GISWORKSHOP


