
So much to learn! Here is my distillation of the main take-homes from last week.
Notes about the workshop in general:
- Making participants do organized homework and install software is necessary for complicated workshop content: http://neondataskills.org/workshop-event/NEON-Data-Insitute-2017
- NEON used tips from software carpentry workshops, particularly the green-and-pink sticky tag tip. When you put up a pink sticky on your computer, you need help; when you put up a green sticky on your computer, you are all good. This makes everything go smoother and means participants don't have to hold up their hand to get attention.
- Having lots of helpful, friendly faces around to help during the coding bits, and having access to the code when you got behind was critical.
- The workshop content and daily schedule:
NEON data and resources:
- http://www.neonscience.org/resources/data-tutorials
- All the NEON airborne data can be found here: http://www.neonscience.org/data/airborne-data
- For more on when data rolls out, sign up for the NEON eNews here: http://www.neonscience.org/
Other misc. tools:
- For cleaning messy data - check out OpenRefine - a FOS tool for cleaning messy data http://openrefine.org/
- Excel is cray-cray, best practices for spreadsheets: http://www.datacarpentry.org/spreadsheet-ecology-lesson/
- Morpho (from DataOne) to enter metadata: https://www.dataone.org/software-tools/morpho
- Pay attention to file size with your git repositories - check out: https://git-lfs.github.com/. Git is good for things you do with your hands (like code), not for large data.
- Markdown renderer: http://dillinger.io/
- MIT License, like Creative Commons for code: https://opensource.org/licenses/MIT
- There is a new project called "Feather" that allows compatibility between python and R: https://blog.rstudio.org/2016/03/29/feather/
- All the NEON airborne data can be found here: http://www.neonscience.org/data/airborne-data
- Information on the TIFF specification and TIFF tags here: http://awaresystems.be/, however their TIFF Tag Viewer is only for windows.
- All NEON point cloud classifications are done with LASTools. Go LASTools! https://rapidlasso.com/lastools/
- Check out pdal - like gdal for point clouds. It can be used from bash. Learned from my workshop neighbor Sergio Marconi https://www.pdal.io/
- Reflectance Tarps are made by GroupVIII http://www.group8tech.com/
- ATCOR http://www.rese.ch/products/atcor/ says we should be able to rely on 3-5% error on reflectance when atmospheric correction is done correctly (say that 10 times fast) with a well-calibrated instrument.
- NEON hyperspectral data is stored in HDF5 format. HDFView is a great tool for interrogating the metadata, among other things. https://support.hdfgroup.org/products/java/hdfview/

First of all, Pearl Street Mall is just as lovely as I remember, but OMG it is so crowded, with so many new stores and chains. Still, good food, good views, hot weather, lovely walk.
Welcome to Day 2! http://neondataskills.org/data-institute-17/day2/
Our morning session focused on reproducibility and workflows with the great Naupaka Zimmerman. Remember the characteristics of reproducibility - organization, automation, documentation, and dissemination. We focused on organization, and spent an enjoyable hour sorting through an example messy directory of misc data files and code. The directory looked a bit like many of my directories. Lesson learned. We then moved to working with new data and git to reinforce yesterday's lessons. Git was super confusing to me 2 weeks ago, but now I think I love it. We also went back and forth between Jupyter and python stand alone scripts, and abstracted variables, and lo and behold I got my script to run.
The afternoon focused on Lidar (yay!) and prior to coding we talked about discrete and waveform data and collection, and the opentopography (http://www.opentopography.org/) project with Benjamin Gross. The opentopography talk was really interesting. They are not just a data distributor any more, they also provide a HPC framework (mostly TauDEM for now) on their servers at SDSC (http://www.sdsc.edu/). They are going to roll out a user-initiated HPC functionality soon, so stay tuned for their new "pluggable assets" program. This is well worth checking into. We also spent some time live coding with Python with Bridget Hass working with a CHM from the SERC site in California, and had a nerve-wracking code challenge to wrap up the day.
Fun additional take-home messages/resources:
- ISO International standard for dates = YYYY-MM-DD
- Missing values in R = NA, in Python = -9999
- For cleaning messy data - check out OpenRefine - a FOS tool for cleaning messy data http://openrefine.org/
- Excel is cray-cray, best practices for spreadsheets: http://www.datacarpentry.org/spreadsheet-ecology-lesson/
- Morpho (from DataOne) to enter metadata: https://www.dataone.org/software-tools/morpho
- Pay attention to file size with your git repositories - check out: https://git-lfs.github.com/. Git is good for things you do with your hands (like code), not for large data.
- Funny how many food metaphors are used in tech teaching: APIs as a menu in a restaurant; git add vs git commit as a grocery cart before and after purchase; finding GIS data is sometimes like shopping for ingredients in a specialty grocery store (that one is mine)...
- Markdown renderer: http://dillinger.io/
- MIT License, like Creative Commons for code: https://opensource.org/licenses/MIT
- "Jupyter" means it runs with Julia, Python & R, who knew?
- There is a new project called "Feather" that allows compatibility between python and R: https://blog.rstudio.org/2016/03/29/feather/
- All the NEON airborne data can be found here: http://www.neonscience.org/data/airborne-data
- Information on the TIFF specification and TIFF tags here: http://awaresystems.be/, however their TIFF Tag Viewer is only for windows.
Thanks for everyone today! Megan Jones (our fearless leader), Naupaka Zimmerman (Reproducibility), Tristan Goulden (Discrete Lidar), Keith Krause (Waveform Lidar), Benjamin Gross (OpenTopography), Bridget Hass (coding lidar products).

Our home for the week

I left Boulder 20 years ago on a wing and a prayer with a PhD in hand, overwhelmed with bittersweet emotions. I was sad to leave such a beautiful city, nervous about what was to come, but excited to start something new in North Carolina. My future was uncertain, and as I took off from DIA that final time I basically had Tom Petty's Free Fallin' and Learning to Fly on repeat on my walkman. Now I am back, and summer in Boulder is just as breathtaking as I remember it: clear blue skies, the stunning flatirons making a play at outshining the snow-dusted Rockies behind them, and crisp fragrant mountain breezes acting as my Madeleine. I'm back to visit the National Ecological Observatory Network (NEON) headquarters and attend their 2017 Data Institute, and re-invest in my skillset for open reproducible workflows in remote sensing.
Day 1 Wrap Up from the NEON Data Institute 2017
What a day! http://neondataskills.org/data-institute-17/day1/
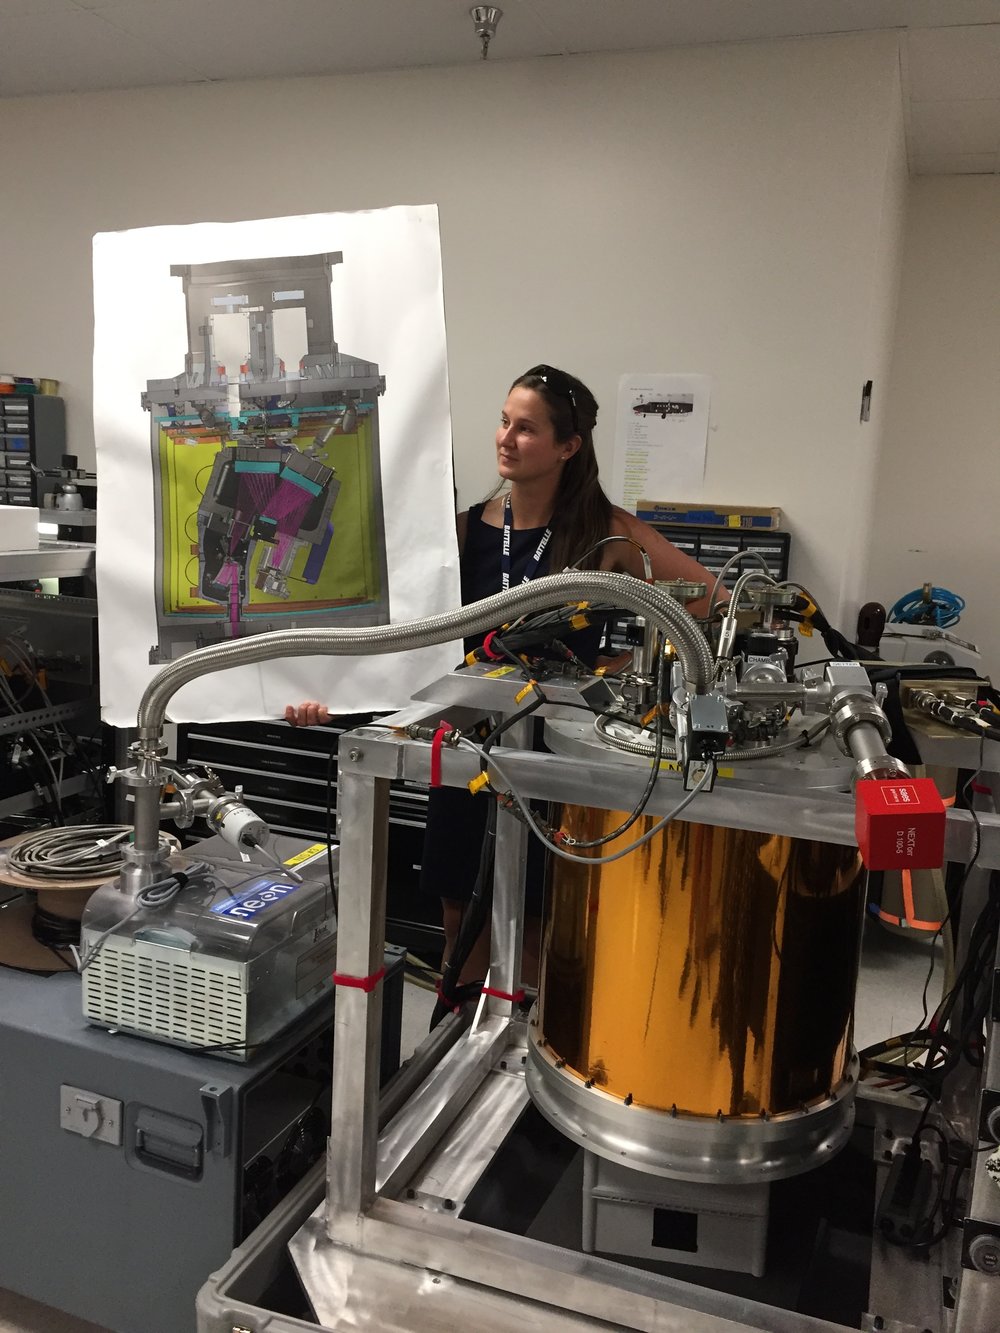
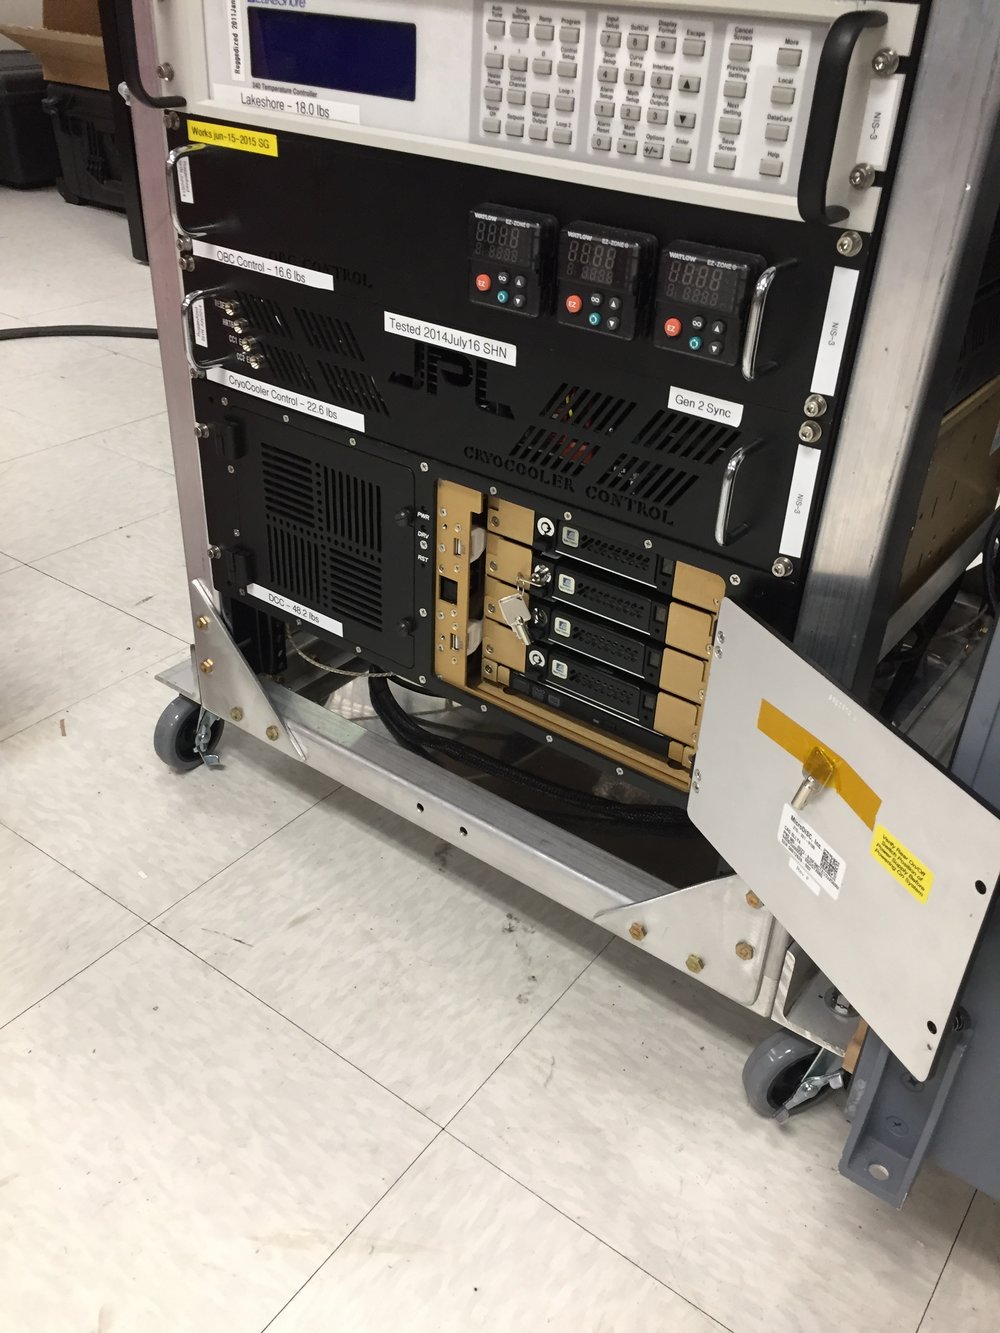
Attendees (about 30) included graduate students, old dogs (new tricks!) like me, and research scientists interested in developing reproducible workflows into their work. We are a mix of ages and genders. The morning session focused on learning about the NEON program (http://www.neonscience.org/): its purpose, sites, sensors, data, and protocols. NEON, funded by NSF and managed by Battelle, was conceived in 2004 and will go online for a 30-year mission providing free and open data on the drivers of and responses to ecological change starting in Jan 2018. NEON data comes from IS (instrumented systems), OS (observation systems), and RS (remote sensing). We focused on the Airborne Observation Platform (AOP) which uses 2, soon to be 3 aircraft, each with a payload of a hyperspectral sensor (from JPL, 426, 5nm bands (380-2510 nm), 1 mRad IFOV, 1 m res at 1000m AGL) and lidar (Optech and soon to be Riegl, discrete and waveform) sensors and a RGB camera (PhaseOne D8900). These sensors produce co-registered raw data, are processed at NEON headquarters into various levels of data products. Flights are planned to cover each NEON site once, timed to capture 90% or higher peak greenness, which is pretty complicated when distance and weather are taken into account. Pilots and techs are on the road and in the air from March through October collecting these data. Data is processed at headquarters.
In the afternoon session, we got through a fairly immersive dunk into Jupyter notebooks for exploring hyperspectral imagery in HDF5 format. We did exploration, band stacking, widgets, and vegetation indices. We closed with a fast discussion about TGF (The Git Flow): the way to store, share, control versions of your data and code to ensure reproducibility. We forked, cloned, committed, pushed, and pulled. Not much more to write about, but the whole day was awesome!
Fun additional take-home messages:
- NEON is amazing. I should build some class labs around NEON data, and NEON classroom training materials are available: http://www.neonscience.org/resources/data-tutorials
- Making participants do organized homework is necessary for complicated workshop content: http://neondataskills.org/workshop-event/NEON-Data-Insitute-2017
- HDF5 as an possible alternative data format for Lidar - holding both discrete and waveform
- NEON imagery data is FEDExed daily to headquarters after collected
- I am a crap python coder
- #whofallsbehindstaysbehind
- Tabs are my friend
Thanks to everyone today, including: Megan Jones (Main leader), Nathan Leisso (AOP), Bill Gallery (RGB camera), Ted Haberman (HDF5 format), David Hulslander (AOP), Claire Lunch (Data), Cove Sturtevant (Towers), Tristan Goulden (Hyperspectral), Bridget Hass (HDF5), Paul Gader, Naupaka Zimmerman (GitHub flow).


They say:
Are you a college student, researcher or professor? We’re looking for innovative academics, researchers and scientists to unlock the power of a one-of-a-kind dataset. You can now apply for access to Planet’s unique dataset for non-commercial research purposes. In an area as large as 2,000 square kilometers, you’ll have access to download imagery, analyze trends, and publish your results.
Check it: https://www.planet.com/products/education-and-research/

- Author: Sean Hogan
I was honored last week to be a presenter at the AmericaView Winter Business Meeting, in Reston Virginia, as representative of the CaliforniaView section of this nationwide consortium of remote sensing scientists. AmericaView shares many of the same interests as the IGIS program, such as applied remote sensing research, outreach, education, workforce development and technology transfer. At this particular meeting of over 50 remote sensing experts, I spoke about some of the ways that the University of California is using drones to advance environmental and agricultural research; including the use of automated photogrammetry for elevation modeling, thermal imagery for water use efficiency, multispectral cameras for monitoring post-fire vegetation recovery, Lidar for tree structure modeling, and hyperspectral scanners for invasive pest detection.
While my presentation and participation at the AmericaView meeting went very well, the highlight of my trip was being invited to Capitol Hill to meet with California Congressman Ami Bera, and staffers for Senator Diane Feinstein and Congressman Paul Cook. The objective of these meetings was to advance awareness for the importance of remote sensing resources, such as the USGS's provision of data from the Landsat satellite missions. In particular, our meeting with Dr. Ami Bera went fantastic. He is such a great and knowledgeable supporter of the scientific outreach we at the UC Division of Agriculture and Natural Resources undertake, and understands the importance supporting the scientific infrastructure that many of us rely on for our research and educational efforts.
Left to right – Pia Van Benthem, Dr. Ami Bera, myself, and Dr. Susan Ustin


