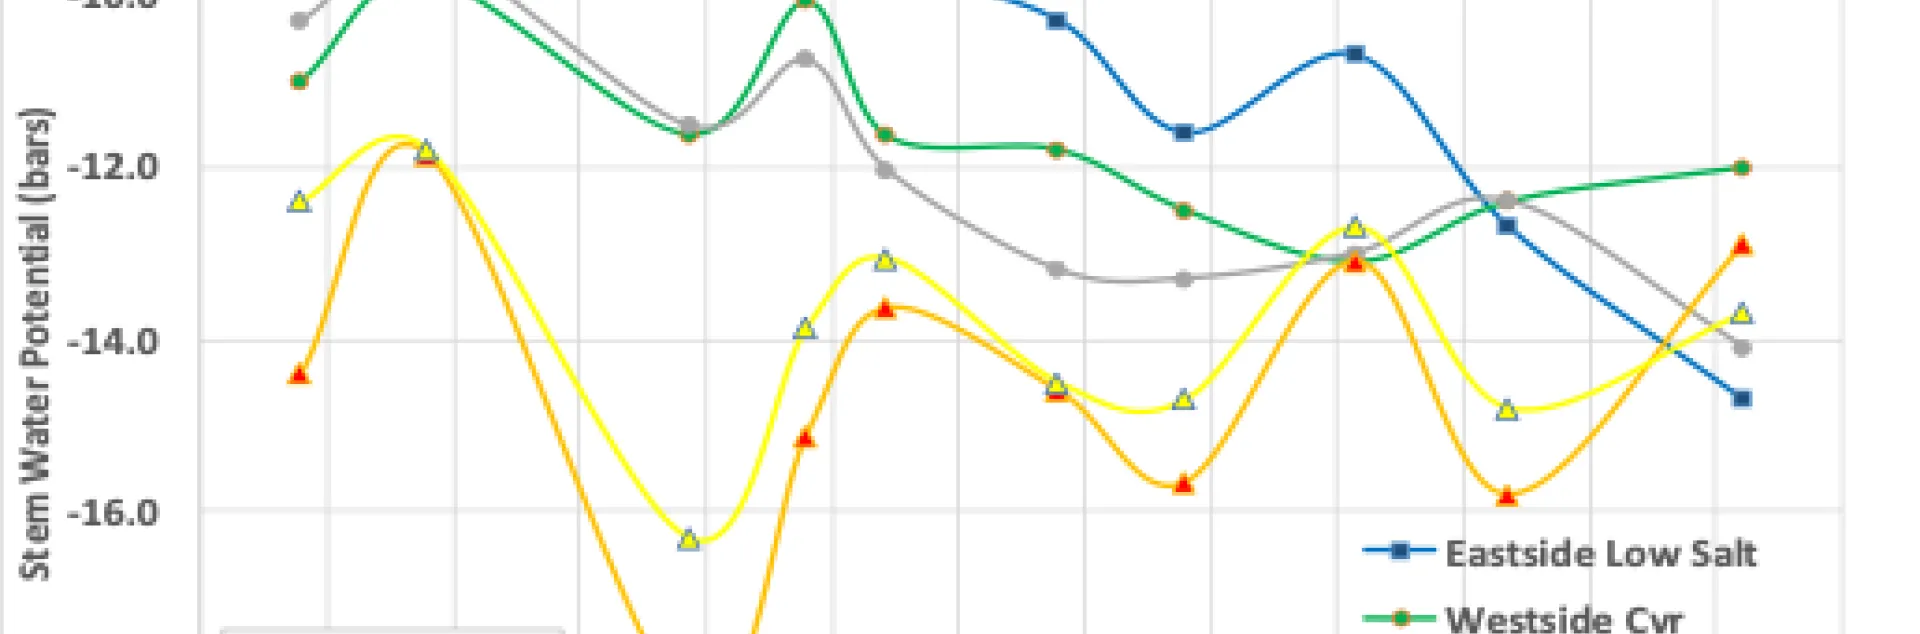
PRESSURE BOMB COMPARISON ACROSS ALL FIELDS


The above figure for 2020 shows that the non-saline Eastside and Westside fields are closer than they were for 2019 until the end of August. At this time, the non-saline east field showed the greatest stress at -14 bars and even more stress after harvest (10/2) at -16 bars. This field has been deficit irrigated due to infiltration and disease issues, receiving about 4 inches less water than the other fields since May. I can't say why, but from 7/23 – 8/31, the SWP for the MidSalt and HiSalt sites showed the same non-stressed value of -12 bars. The additional osmotic stress from the hi-salt area should cause an SWP that is about -2 bars more stress than the mid-salt area and non-saline eastside and westside. Good irrigation scheduling and high frequency pulsed irrigation are helping this saline field.
IRRIGATION AND SOIL MOISTURE COMPARISON ACROSS ALL FIELDS

We have in-hose flowmeters at the exact location of every monitoring site in each of the 3 fields recording actual irrigation inches run through that hose. The cumulative irrigation for each site is shown in the above chart along with the calculated ET using the Goldhamer crop coefficients (Kc) for pistachio and the Stratford CIMIS station. As you can see, all sites received less water than the calculated ET. Does this mean that every site was deficit irrigated and stressed more than it should have been? Not necessarily – look again at the 2020 SWP chart and you can see that for nearly all the season the SWP was between -12 to -14 bars. This indeed is mild stress indicating some deficit in water status but the CERES imagery and Phytech MDS also showed minimal tree stress for most of the season.
For all of these mature orchards, except for the really bad soil in the Lemoore High Salinity site, we have excellent available soil moisture storage and rooting to 6 feet. The below chart shows the summed available inches to this depth over the season. The Lemoore HiSalt site shows nearly double the stored water of the Westside NoCvr site because of a high clay content and poor structure in this sodic Lethent silty clay compared to the well-drained and aerated Cerrini sandy loam at the NoCvr site.

The below table now takes the cumulative irrigation over the season and adds in the season end (10/2, here) depletion of stored soil moisture from the highest storage point earlier in the season. Depending on the site, this depletion was as little as 2.4 inches to about 6 inches. Adding these depletions back into applied water puts us real close to the calculated 46” of Goldhamer ET for the Westside Cvr and NoCvr. The Eastside Low Salt is now 40.3” and the Lemoore MidSalt and HiSalt sites with less canopy are the lowest, as expected, with 39.9 and 34.3”. It is probably correct to say that the Eastside field had more deficit irrigation than desirable given the amount of yellow and red stress colors appeared in the CERES images over the season and have a final SWP of -16 on 10/2.

NON-SALINE EASTSIDE FIELD


AERIAL IMAGERY:
The green to red image on the left indicates the volume and vigor of the canopy foliage as a Normalized Differential Vegetative Index (NDVI). The right image shows the relative water stress across the orchard as calculated using the infrared canopy temperature. The Demo monitoring is mostly for the western 80 acres in these images. Compare the 10/8 post-harvest to the 8/31 pre-harvest image. The amount of red-yellow stressed acreage increased by 30-50% over the harvest cutoff with minimal irrigation. But if you look closely at the SWP, which were actually taken 10/2, for the west 80 acres and the SE 40 acres these remained almost the same at around -14 to -16 bars – mild stress. However, these monitoring sites were chosen because the trees looked a bit better than average for the orchard. These images confirm that these trees are on good dirt with a better than average water holding capacity compared to the rest of the orchard and they still show blue to green while the rest of the orchard is yellow-red. However, the NE field has turned uniformly yellow-red – including the monitoring site which registered a very stressed SWP of -24 bars. Why we see the very high stress on the NE field compared to the other two is a mystery. All three fields are irrigated on the same schedule and receive virtually the same amount of irrigation.
The original CERES flyover date was set for Friday 10/2 to match the field data collection, but the smoke from the scattered fires across California had blown down to the southern SJV and was too thick on that day to do good imagery. We obtained this 10/8 image as part of another project, but there is no imagery for the 4 westside non-saline and saline monitoring sites (2 fields).
TREE STRESS: Using the tree and its larger root system as continuous integrated moisture monitor obviously gives you a more comprehensive picture than the small sphere of influence you get with a tensiometer, Watermark block or capacitance probe. Stem water potential (SWP, the first chart in this BLOG) using a bagged leaf or wrapping a leaf with a wet rag for 15 seconds before picking is the industry standard for tree stress. This is a good snapshot indicator of internal water stress right then but can be misleading without a knowledge of the real-time trend in tree stress. There are different sensors out there now trying to do real-time tracking of sap flow, leaf stomatal conductance and internal osmotic tension in the tree sap. These measurements are different from a straight pressure chamber SWP but closely related. The problem with most of these sensors is maintaining stable readings and getting a true average for the whole tree over time. For this Pistachio Irrigation Monitoring/Scheduling Demo we are using a dendrometer that measures the real-time daily shrink/swell and growth of the tree trunk. This device is less prone to placement and instrument error than other the commercial sensors mentioned above. The Phytech Company is helping us by supplying their dendrometers attached to three trees and real-time web-based reporting system that tracks the average shrinkage during the day and swelling at night – MAXIMUM DAILY SHRINK/SWELL, MDS, as an indicator of water stress, and average growth over time.

This is exactly the pattern that you want to see, up to mid-July – steadily increasing growth running 15-30 microns/day over the spring and early summer. From Mid-June to July 17 these trees averaged 6000 microns (6 mm) additional radial growth. That's a 12 mm, or almost ½ inch increase in trunk diameter. The blue bars indicate the timing and duration of irrigation of this high frequency double-line drip system. But from the end of July there is very little growth – probably due to the carbohydrate demand from the filling nuts. You would still like to see a little more growth than shown but the good news is that the daily shrink/swell (shown by the daily high and low in the chart and numbers at the bottom) is in the non-stressed range of 30-40 microns.
Notice the flat line starting 9/6. That's when we removed the dendrometers from the trees so they wouldn't be damaged by the shakers. They were reinstalled 10/7 (below chart). Notice that the MDS is almost the same as the end of August running about 30-40 microns even though the average SWP was -16 on 10/3. But the real-time irrigation monitoring (blue bars) shows they kicked up the irrigation to 6 hours/day on 10/9&10. The CERES flyover occurred 10/8, just before these irrigations.

We also have the same Phytech system on the NE 40 acres block as we do with the west 80 acres. So what about the -24 bar SWP stress we measured on the NE block on 10/3 and all the yellow-red showing in the CERES image from 10/8? Fortunately, we got the dendrometers back on the NE trees 10/2, which showed an MDS of 65 microns. MDS for 10/3 (coinciding with the -24 bar SWP measurement) was 90 microns, but the very sharp peak means there may have been a hiccup in the reading and more like 50 or 60 microns is the reality. From 10/4 on the MDS shows 20-40 microns – no stress. A -24 bar SWP should cause an MDS of closer to 150 microns! I have no explanation for this discrepancy.

JAIN LOGIC/SENTEK CAPACITANCE SOIL MOISTURE:
The ROOTZONE SUM chart below from the Jain Logic monitoring system using a Sentek Drill & Drop capacitance probe that measures soil moisture to a depth of 46 inches shows that the total root zone soil moisture has fallen off about 25% during harvest cutoff. The numbers on the Y-axis in the bottom left chart are the sum of the percent soil moisture measured by each sensor placed every 4 inches. If these numbers were absolutely accurate, it would mean that this Nord Series fine sandy loam soil would hold 42% water by volume (5.0”/ft) at field capacity, which is impossibly high. The correct number is about 28%, 3.4 inches/foot (about 2” available) as measured by a neutron probe. But the good news is that the trends in increased and decreased water content are very real and dependable. Therefore, the infiltration chart (top left) is an accurate indicator of how deep water penetrates (dark blue columns) every irrigation. This shows that the water only went to 30” over the last month, so there is no deep percolation lost below the root zone. The capacitance probe appears to have stopped working on 10/3. The Jain Logic estimate of total applied water is generated by a pressure sensor in the drip hose then multiplying the hours with pressure on by the system flowrate to get the applied inches. But right now this is only 26.8” compared to the 35.4” we have measured because this does not account for the 5” of flood water applied and a couple inches applied before May 1.

WESTSIDE NON-SALINE

AERIAL IMAGERY: Unavailable due to excessive smoke in the air.
PLANT STRESS
Unfortunately, the two Phytech systems in the Cover and Non-Cover crop monitoring sites in this 310 acre field have not been working for the last 2 months. They should be back on-line soon. The excellent average SWP of -12 to -13 bars was no surprise given the water scheduled to this block.
JAIN LOGIC/SENTEK CAPACITANCE SOIL MOISTURE
We have two sites in this field with instrumentation. The NO COVER site below is 80 rows east of the west edge of the field with the soil classed as a Cerrini sandy loam. The soil at this site is sandier than the Eastside field. The irrigation system is a single-line drip with four 1 gallon/hr drippers per 16 x 19 foot tree spacing. Irrigation was typically a 24 hr set every other day starting in June. With a second new filter station on-line for the field the grower ran two 72 hour sets back to back the third week of July to max out his rootzone storage. The below Infiltration chart (top left) shows a 96 hour set starting 9/21 to recover soil moisture lost during the harvest cutoff for the first shake. The recharge makes it all the way to 46”. Irrigation is cutoff the morning of 9/25 and the 2nd shake happens 10/1. The soil moisture storage chart (bottom left) shows a recharge and subsequent depletion of about 100 mm from 9/21 to 10/5 – about 4 inches. But wait a minute – this system has an application rate of 0.52 inches/day and it only ran 4 days, so that's 2.08”. The trick here is knowing the subbing volume of the drip pattern. The system application rate of 0.52”/day is for the whole acreage – 19 feet across the row, but if the drip pattern only subs across say 35-50% of the rootzone then the 0.52”/day becomes a 1 to 1.5 inch/day of actual wetting by the capacitance probe. Likewise, if the ET = 0.3”/day, then that becomes a depletion of 0.6 to 0.9”/day in the wetted rootzone.

The COVER crop site (below) is 30 rows from the eastern edge of the field and is a Calflax clay loam with a definitely higher water holding capacity than the Cerrini SL in the NO_COVER area. This location and the NO_COVER location are in the same irrigation set, receiving water at the same time and duration – typically 24 hours for a normal set. But with a heavier soil, this site appears to have a greater zone of subbing than the Cerrini SL. However, the recharge and the subsequent water use for the same 96 hour set as shown above is only shown to be about 25-30 mm at this site – barely 1” depth – not even the full 2” per system design. However, the infiltration chart (top left below) still shows water penetrating to the 46”. This shows the problem of calibration for this kind of technology. The trends shown in both charts are nearly identical – indicating good recharge and subsequent water use by the trees in between first and second shake, but the actual numbers at the Calflax site are not correct.

LEMOORE SEMI-SALINE AND SALINE
AERIAL IMAGERY: Excessive smoke prevented the scheduled CERES flyover for 10/2.

PLANT STRESS: The salt burn is quite apparent at both sites, but at the highly saline site the burn has consumed about 25-40% of the leaf while at the semi-saline site maybe <10% of leaf area. The burned tissue plus the reduced canopy oddly works to make the SWP less negative (less stressful) then it would be due to the increased osmotic resistance to water uptake under these highly saline conditions. This means that the average SWP at the HiSalt site is barely more stressed at -14.1 bars compared to the MidSalt location averaging -13.4 bars.
But looking at the Phytech dendrometers shows an average Maximum Daily Shrink/swell (MDS) of 30-35 microns for the semi-saline D05 site compared to an average 40-50 microns MDS for the Saline D03 site – basically a 30% higher stress due to increased salts at this site.


SOIL MOISTURE, SEMI-SALINE: The second highest total Root Zone Summed water content is this area – reflecting a soil texture finer than any of the non-saline problem fields and very slow drainage through the profile. The deepest penetration during an irrigation is only 12-14”. The impact of anoxia (waterlogging) has just as much negative impact on pistachio growth as does drought and high salinity. So the grower uses 3 hour pulsed irrigation once or twice daily with this high-tech automated Wise-Con irrigation system in an attempt to reduce water-logging while recharging some of the soil moisture lost during harvest cutoff.

SOIL MOISTURE, SALINE: The highest total Root Zone Summed water content is in this area (D03) of the field. Frequently prone to ponding many trees have died here. The deepest recorded irrigation penetration for any 3 to 8 hour event is 14”. Installing an automated WiseCon irrigation system to run very short sets as often as daily has been the best strategy the grower found to reduce anaerobic conditions in the root zone and improve tree growth. Irrigation was cutoff for harvest on 9/4 and restarted for 5 days on 9/18.
