Emitter Sampling for Distribution Uniformity Determination
Drip emitters rarely discharge water at the exact specified rate or uniformly across the irrigation system. For example, a 0.5 gallon per hour (gph) dripper may not actually be discharging at 0.5 gph. Manufacturing differences, clogging, and slope may cause emitters to discharge at variable rates throughout the block. Emitters throughout each irrigation block must be sampled for accurate and efficient scheduling. After emitters have been sampled, calculate the distribution uniformity (DU) of the block manually (DU worksheet), or using excel (bilingual DU Excel worksheet).
Distribution uniformity is expressed as a percentage (100% being completely uniform) and is calculated from measured, actual discharge rates of sampled emitters.
1. Each irrigation block should be evaluated separately because blocks may be operated at different pressures.
2. Sample drip emitters at the following locations. Download the DU worksheet to record emitter discharge in the field.
Head of the system Middle of the system Tail end of the system
| Sample 4 emitters at each location within block 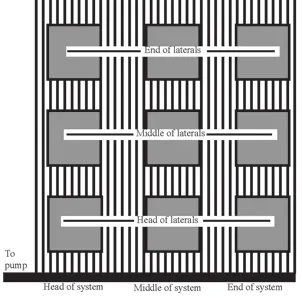 |
In addition, you might sample at any other spots where you suspect there could be a difference in the pressure and discharge rate. For example, go to low or high elevation areas in the vineyard. More emitters than suggested above should be sampled on large irrigation blocks (greater than 20 acres).
3. Collect water from selected drip emitters.
4. Use a 100 ml graduated cylinder to measure water discharged from emitters for 30 seconds in, or record the number of seconds it takes to fill a 35 mm film canister (see Table 1 and Table 2 respectively). Use the appropriate table to convert the amount of water collected from each sampled emitter to the discharge rate in gallons/hour for that emitter.
Table 1. Determining drip emitter discharge rate in gallons per hour (gph) using a graduated cylinder.
| Milliliters of water collected in 30 seconds | Drip emitter discharge rate (gallons/hour) | Milliliters of water collected in 30 seconds | Drip emitter discharge rate (gallons/hour) |
| 10 | 0.32 | 42 | 1.33 |
| 12 | 0.38 | 44 | 1.39 |
| 14 | 0.44 | 46 | 1.46 |
| 16 | 0.51 | 48 | 1.52 |
| 18 | 0.57 | 50 | 1.59 |
| 20 | 0.63 | 52 | 1.65 |
| 22 | 0.70 | 54 | 1.71 |
| 24 | 0.76 | 56 | 1.78 |
| 26 | 0.82 | 58 | 1.84 |
| 28 | 0.89 | 60 | 1.90 |
| 30 | 0.95 | 62 | 1.97 |
| 32 | 1.01 | 64 | 2.02 |
| 34 | 1.08 | 66 | 2.09 |
| 36 | 1.14 | 68 | 2.15 |
| 38 | 1.20 | 70 | 2.22 |
| 40 | 1.27 | 72 | 2.28 |
A 100 ml graduated cylinder works well. These are available online from most educational science suppliers. If possible, use a glass cylinder because it is easier to read than plastic.
Values in Table 1 were calculated using the following equation:
Drip emitter discharge rate (gph) = water collected in 30 seconds (ml) x 0.0317
Table 2. Determining drip emitter discharge rate in gallons per hour (gph) using a 35 mm film canister
| Seconds to fill a 35 mm film canister | Drip emitter discharge rate (gallons/hour) | Seconds to fill a 35 mm film canister | Drip emitter discharge rate (gallons/hour) |
| 26 | 1.28 | 50 | 0.67 |
| 28 | 1.19 | 52 | 0.64 |
| 30 | 1.11 | 54 | 0.62 |
| 32 | 1.04 | 56 | 0.59 |
| 34 | 0.98 | 58 | 0.57 |
| 36 | 0.92 | 60 | 0.55 |
| 38 | 0.88 | 62 | 0.54 |
| 40 | 0.83 | 64 | 0.52 |
| 42 | 0.79 | 66 | 0.50 |
| 44 | 0.76 | 68 | 0.49 |
| 46 | 0.72 | 70 | 0.48 |
| 48 | 0.69 | 72 | 0.46 |
Values in Table 2 were calculated using the following equation:
Drip emitter discharge rate (gph) = 33.29 ÷ Time to fill 35 mm film canister (seconds)
Resources and related articles:
- DU worksheet
- DU Excel worksheet - bilingual
- Calculation of drip application rate (gph & in/hr)
- Irrigation system distribution uniformity
- What is acceptable distribution uniformity (DU)?