
Fact Sheet • University of California Research Consortium on Beverages and Health • American Heart Association • November 2022 • Download PDF (250 KB)
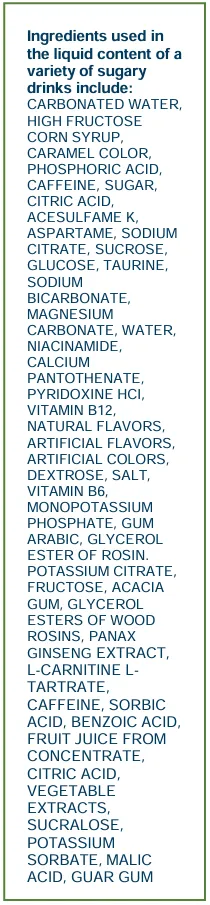
What’s in the can?
The liquid contents of sugary drinks are produced from both agricultural products and manufactured chemical compounds. Scientists studied the liquid contents of all the beverages sold in one year on a university campus1 and found:
- The average greenhouse gas emissions (GHGE) from sugary drink manufacture, per liter of average content, were 81 times greater than that of a liter of tap water.
- It took an average of 153 liters of fresh water to manufacture each liter of sugary drink.

What about the container?
Per liter of content, every plastic bottle produces 11 times more GHGE, uses 27 times more water, and produces 440 times more plastic pollution than a reusable stainless steel water bottle with a plastic cap.
Are there other environmental impacts?
In addition to these direct environmental impacts of sugary drinks, there are indirect environmental impacts. For example, sugary drink consumption is a risk factor for many diet-related illnesses. These illnesses require healthcare. Healthcare generates tremendous greenhouse gas emissions. In 2013, GHGE from U.S. healthcare made up 9.8% of total national GHGE.2
Beverage choice makes a difference.3 What’s your choice?
References
- Meisterling K et al. 2022. Healthy beverage initiatives: A case study of scenarios for optimizing their environmental benefits on a university campus. Cleaner and Responsible Consumption, 4:100049.
- Eckelman MJ & Sherman J. 2016. Environmental Impacts of the U.S. Health Care System and Effects on Public Health. PLoS ONE 11(6):e0157014.
- Patel AI et al. 2020. Drinking Water in the United States: Implications of Water Safety, Access and Consumption. Ann Rev Nutr. 40:345-373.
Graphics: Kasmira Lada, by permission of the artist
Suggested Citation: Fact Sheet: The Heavy Environmental Impact of Sugary Drinks. University of California Research Consortium on Beverages and Health. American Heart Association. November 2022.
The University of California Research Consortium on Beverages and Health includes faculty from every UC campus working to provide California legislators and communities with the science base for policy to decrease consumption of sugary drinks and increase consumption of water and other healthy beverages.
University of California Research Consortium on Beverages and Health • Bringing Science to Policy • Find our entire factsheet series at https://npi.ucanr.edu/Resources/UCRCBH/ • For more information contact: ceahecht@ucanr.edu •
